Visualize Your Money Trends With a Waterfall Chart in Google Sheets

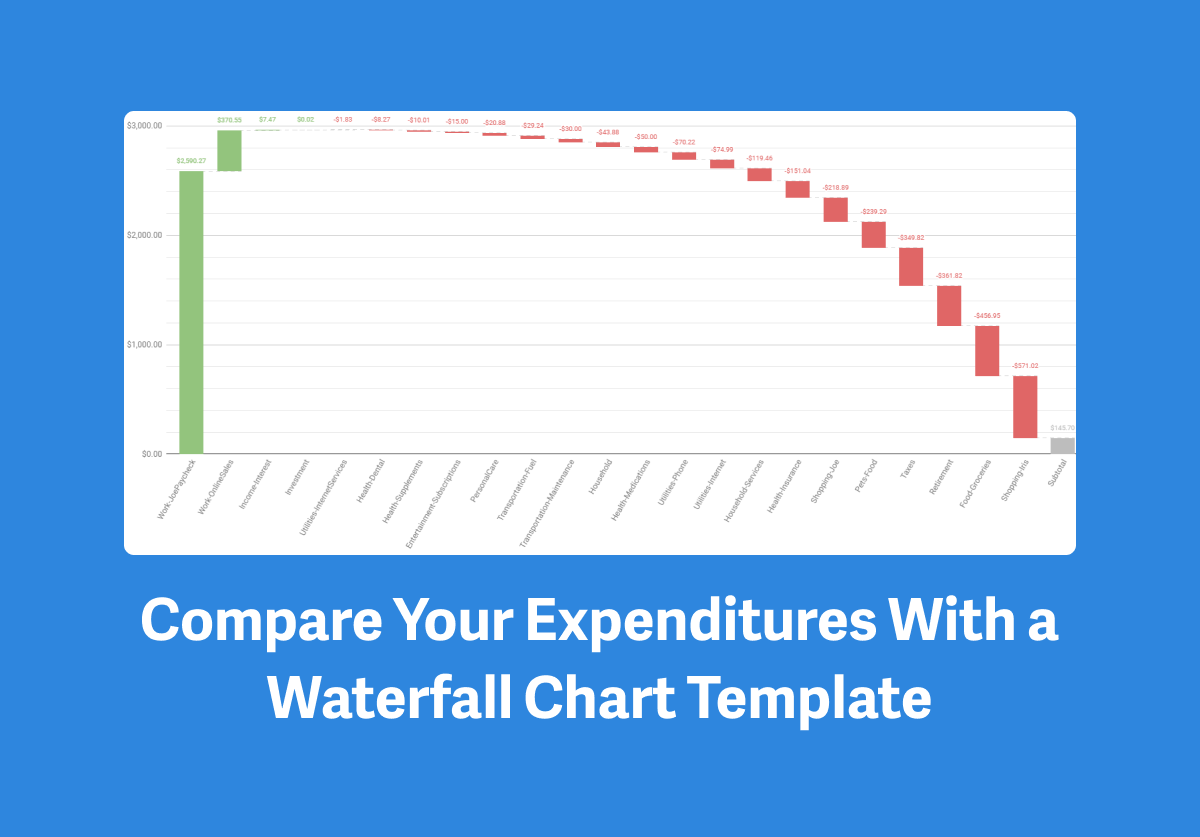
Here's a free waterfall chart template for Google Sheets to show how your money trends change over time.
Easily create your own custom spreadsheet charts in Google Sheets. In this example, we use your spending data imported by Tiller.
You can use this same concept of creating charts to visualize and track personal finance goals across all areas in Google Sheets with Tiller - not just savings.