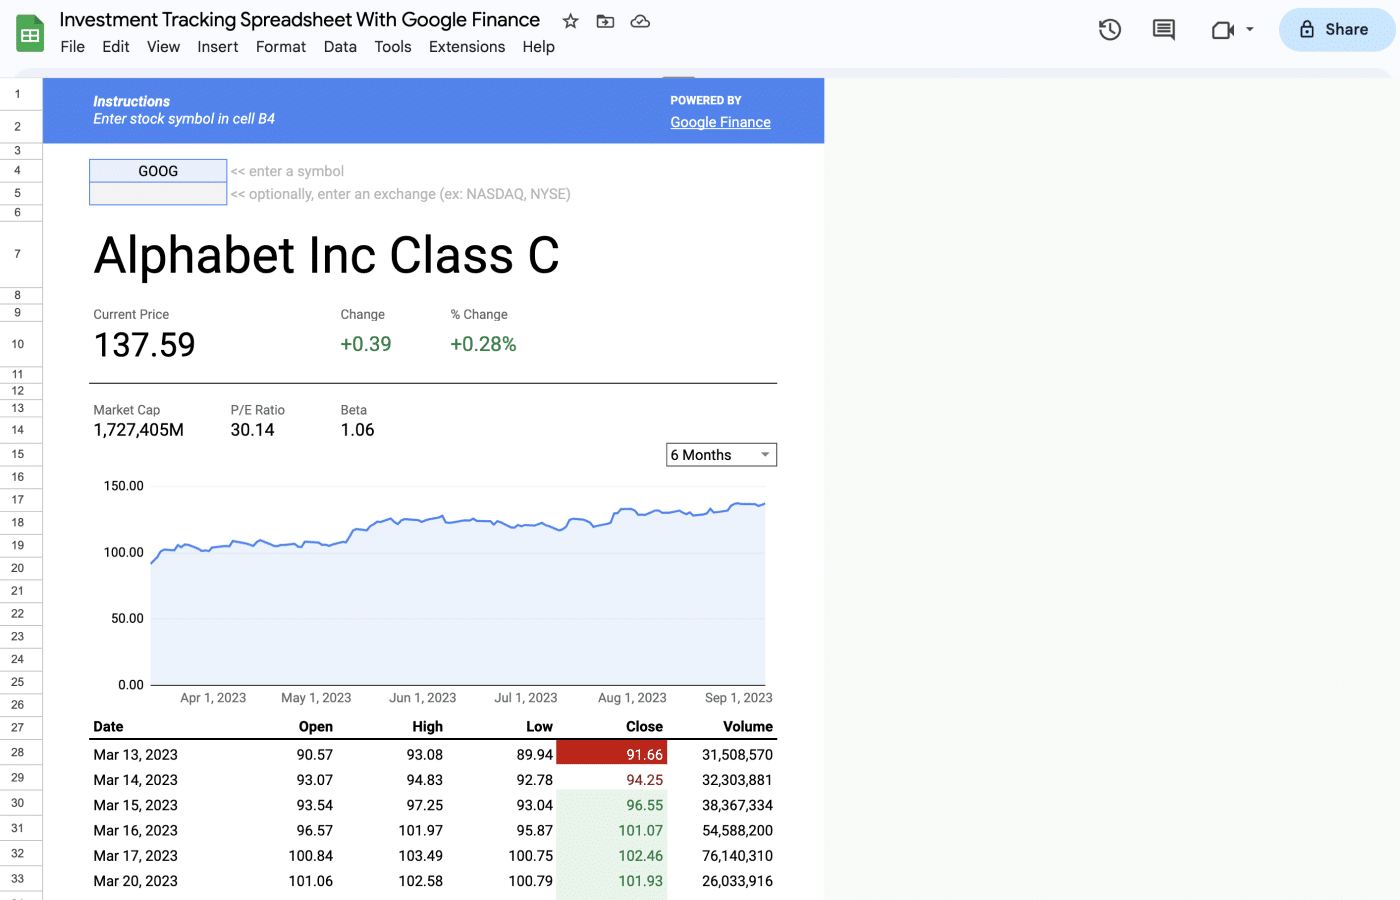
This simple Investment Tracking Spreadsheet makes it easy to track the daily price history of your stocks in Google Sheets.
The template includes an editable Watchlist sheet where you enter the symbol of the stocks you want to track.
With a large graph, the Price History sheet then shows the daily open, high, low, and close prices of your selected stocks, plus daily trade volume.
All data is pulled from Google Finance.
With spreadsheet skills, you could easily further customize this sheet with technical indicators, valuation ratios, earnings reports and more.

