Investment Tracking Spreadsheet

Track the daily price history of your stocks in Google Sheets with this simple template powered by Google Finance.

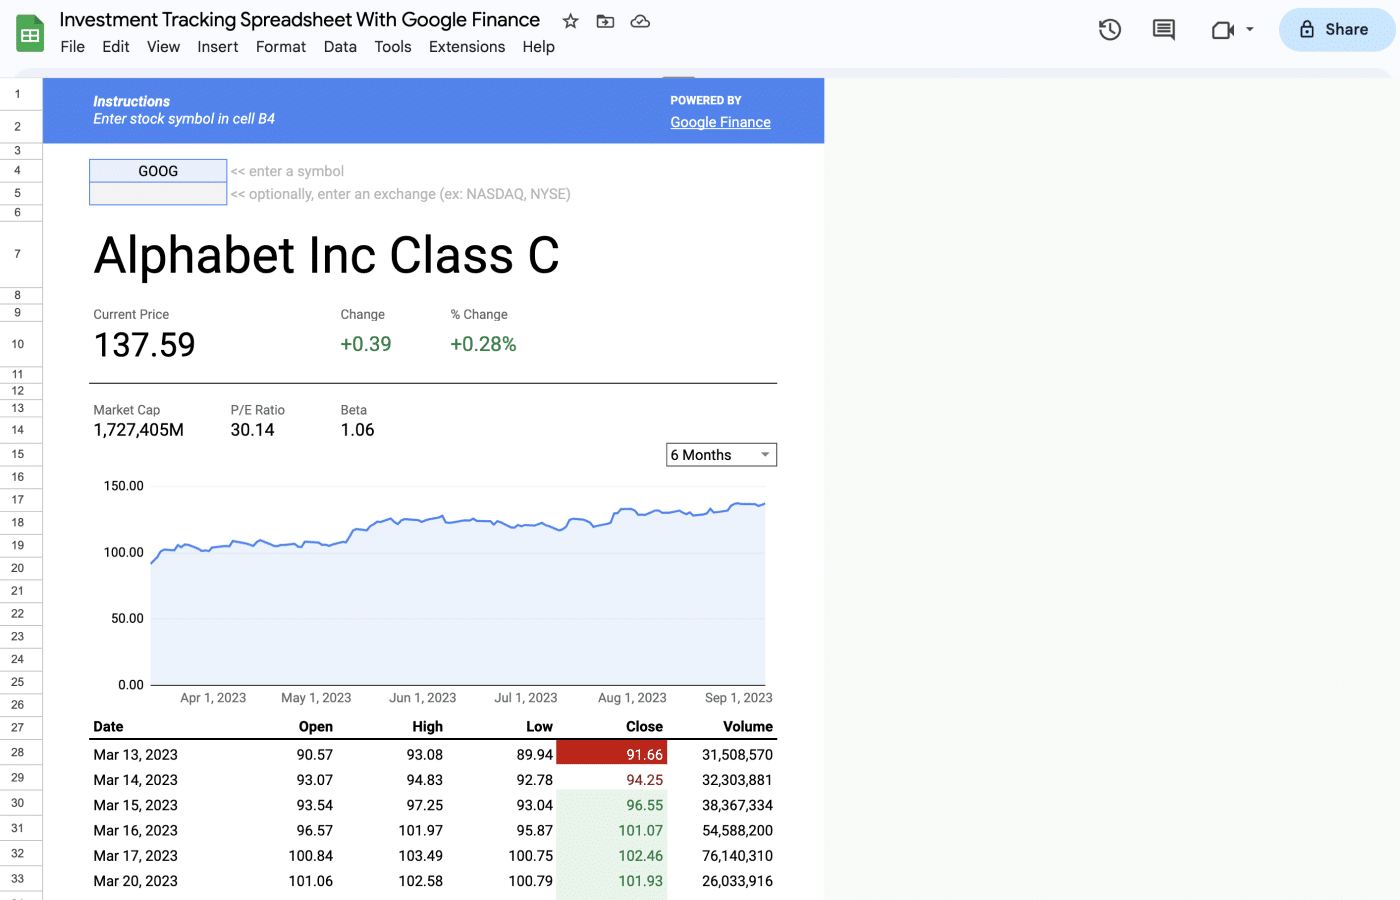
This simple Investment Tracking Spreadsheet makes it easy to track the daily price history of your stocks in Google Sheets.

The template includes an editable Watchlist sheet where you enter the symbol of the stocks you want to track.

With a large graph, the Price History sheet then shows the daily open, high, low, and close prices of your selected stocks, plus daily trade volume.

All data is pulled from Google Finance.

With spreadsheet skills, you could easily further customize this sheet with technical indicators, valuation ratios, earnings reports and more.
FAQ

This is a free template built by a member of the Tiller Community. While it’s free for anyone to use, it’s designed for spreadsheets automated by Tiller. Additionally, it’s recommended for use within the Foundation Template.

Tiller is the only automated personal finance service for Google Sheets and Microsoft Excel. Tiller automatically imports your daily spending, income, and balances in your spreadsheets, so you can see all your finances in one place and manage your money, your way. Learn more →

Follow the installation instructions above.

4.8 star rating - September 2024

Start Your Free Trial

Keep a clear, confident view of all your money in one place, with flexible templates, powerful privacy, and top-rated support

"There isn’t another tool on the market that does what Tiller can do.”
Will Hinton, Google Review October 30, 2023