Start Your Free Trial
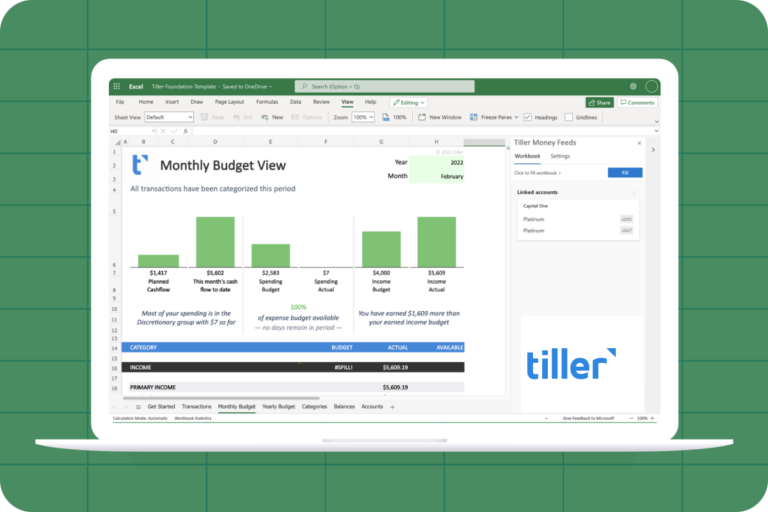
Keep a clear, confident view of all your money in one place, with flexible templates, powerful privacy, and top-rated support
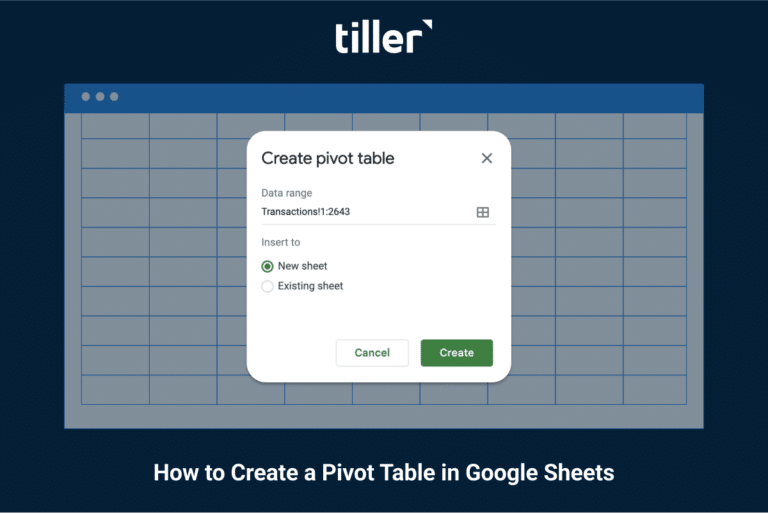
A Google Sheets pivot table is one of the most powerful tools for understanding your data in a spreadsheet. Here's how to get started in a few simple steps.
Beat inflation with over 50 ideas for budgeting and saving money from the Tiller Community
Pie charts are visually interesting and friendly. Bar charts can clearly show a larger number of categories and convey absolute and relative value. So which do you prefer?
Automatically track your daily net worth with flexible, private spreadsheets powered by Tiller
See how Tiller leverages the secure, user-friendly sharing features of spreadsheets so you can collaborate on your finances with your partner, spouse, or financial planner.
Browse all videos in this series: Additional Resources: Edited video transcript: In this post, we’ll explore the endless possibilities of analyzing your financial data in Tiller-powered spreadsheets using pivot tables. Pivot tables are an easy way to experience the true…
Keep a clear, confident view of all your money in one place, with flexible templates, powerful privacy, and top-rated support