Category Tracker for Microsoft Excel
Build a pie chart visualizing your spending and income over a completely customizable date range with the Category Tracker Report for Microsoft Excel.
Net Worth Spreadsheet for Google Sheets
Easily track the most important metrics driving your net worth with this free Google spreadsheet.
Net Worth Snapshot Sheet

Visualize your total net worth as well as trends over a customizable time period. Includes a net worth chart and trends table for up to 12 months of net worth data.
Monthly Analysis Spreadsheet for Google Sheets

Use this Monthly Analysis sheet with your Tiller Foundation Template to visualize your budget, actuals, or remaining money organized by type, group, and category over time.
Yearly Spending Insights Spreadsheet
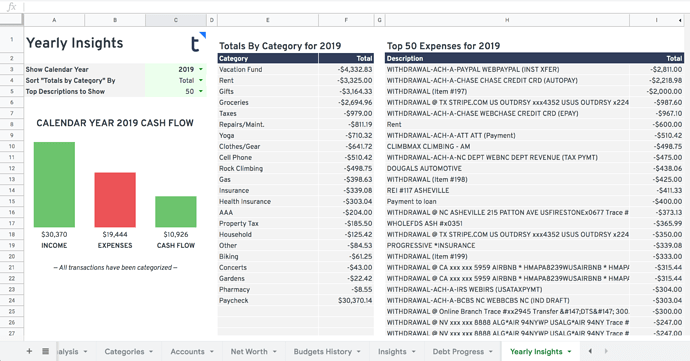
The Yearly Insights spreadsheet is a Google Sheets template that gives you a bird's-eye view of your annual finances — either for the full previous year or current year-to-date.
