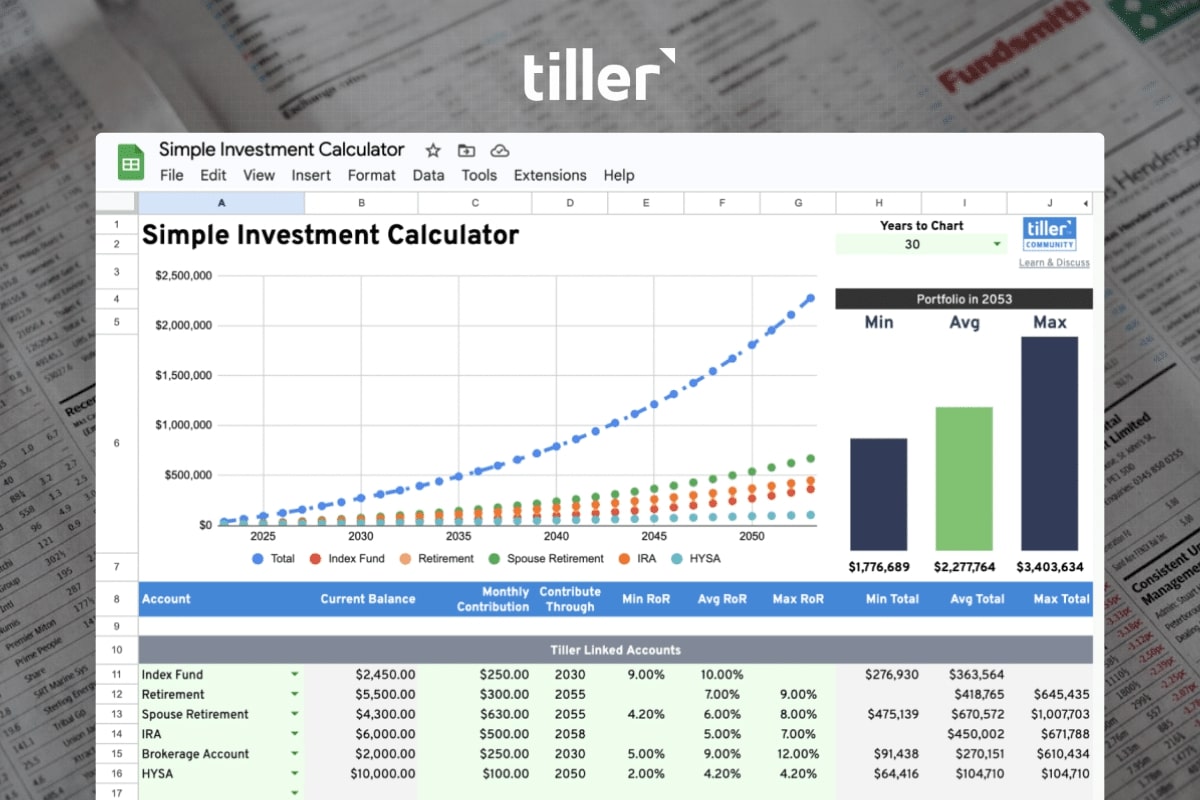
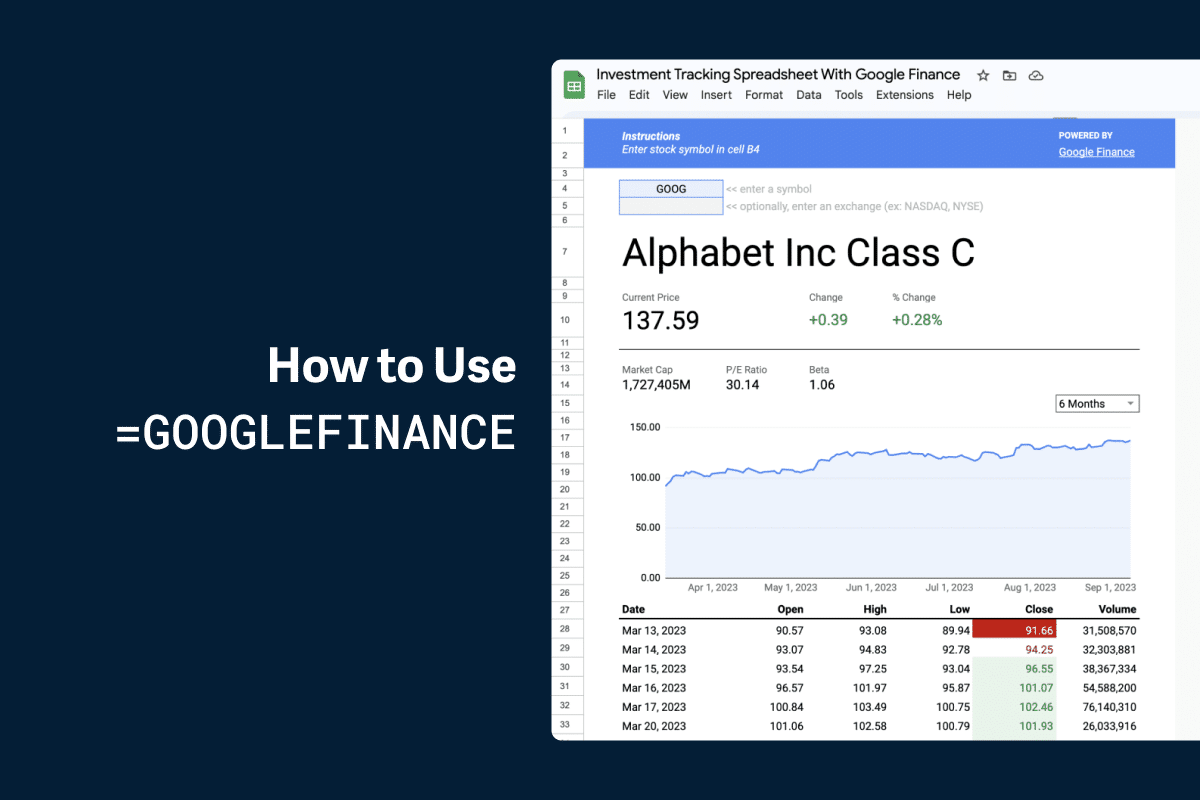
If you’re already using a spreadsheet to manage your finances, you have a powerful tool at your fingertips for tracking your investments. For those with stock holdings in a brokerage account or a 401k, you can leverage Google’s built-in formula:
The
GOOGLEFINANCEformula gets nearly live (with a 20-minute delay) stock price data fed directly into your sheet.
GOOGLEFINANCE(ticker, [attribute], [start_date], [end_date|num_days], [interval])This powerful feature goes well beyond just current stock prices. You can track a security’s opening price, the closing price for any historical date, the daily or 52-week high and low, the average and current daily volume, market capitalization, EPS, P/E ratio, and even currency exchange rates. The possibilities are incredible.

This guide will walk you through how to set up a simple, yet powerful, investment tracker using Google Sheets
Getting Started: The GOOGLEFINANCE Function
The core of your investment tracker will be the GOOGLEFINANCE function. Its basic syntax is straightforward, making it easy to start pulling valuable data immediately.
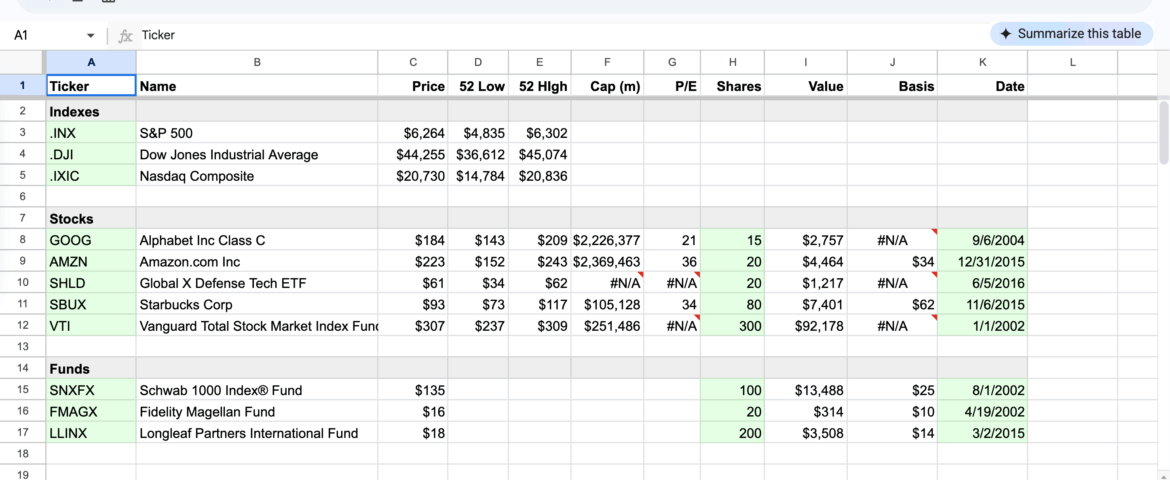
To get the current price of a stock, you only need its ticker symbol. For example, to pull Alphabet’s (Google’s parent company) stock price, the formula would be:
=GOOGLEFINANCE("GOOG", "price") In this example spreadsheet, I’ve created a simple sheet to track some common indexes, stocks, and mutual funds
Accessing Historical Data
The function becomes even more powerful when you want to look at historical performance. For instance, if you want to see Alphabet’s closing price for a specific date range, you can expand the formula. This formula will return a table of closing prices from February 1 through February 10, 2025:
=GOOGLEFINANCE("GOOG", "price", DATE(2025,2,1), DATE(2025,2,10), "DAILY") Building Your Custom Investment Portfolio Tracker
Now let’s build a simple portfolio tracker. To start, you can open our example sheet by clicking here.
Step 1: List Your Holdings
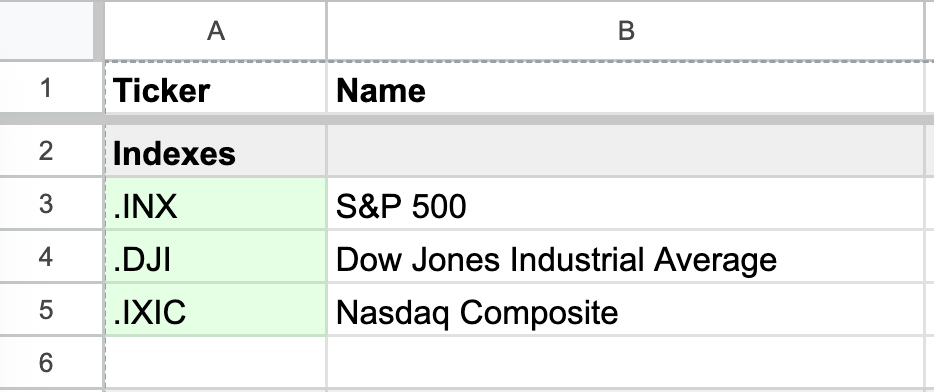
In the first column, list the ticker symbols for your stocks, ETFs, or mutual funds
(e.g., GOOG, VTSAX).
Step 2: Pull Key Metrics
In the adjacent columns, use the GOOGLEFINANCE function to pull the data you want to see. Here are some useful attributes you can track:
- Current Price:
=GOOGLEFINANCE(A2, "price")(assuming the ticker is in cell A2) - Previous Day’s Close:
=GOOGLEFINANCE(A2, "closeyest") - 52-Week High:
=GOOGLEFINANCE(A2, "high52") - 52-Week Low:
=GOOGLEFINANCE(A2, "low52") - Market Cap:
=GOOGLEFINANCE(A2, "marketcap") - P/E Ratio:
=GOOGLEFINANCE(A2, "pe")
Take Your Tracking to the Next Level with Tiller
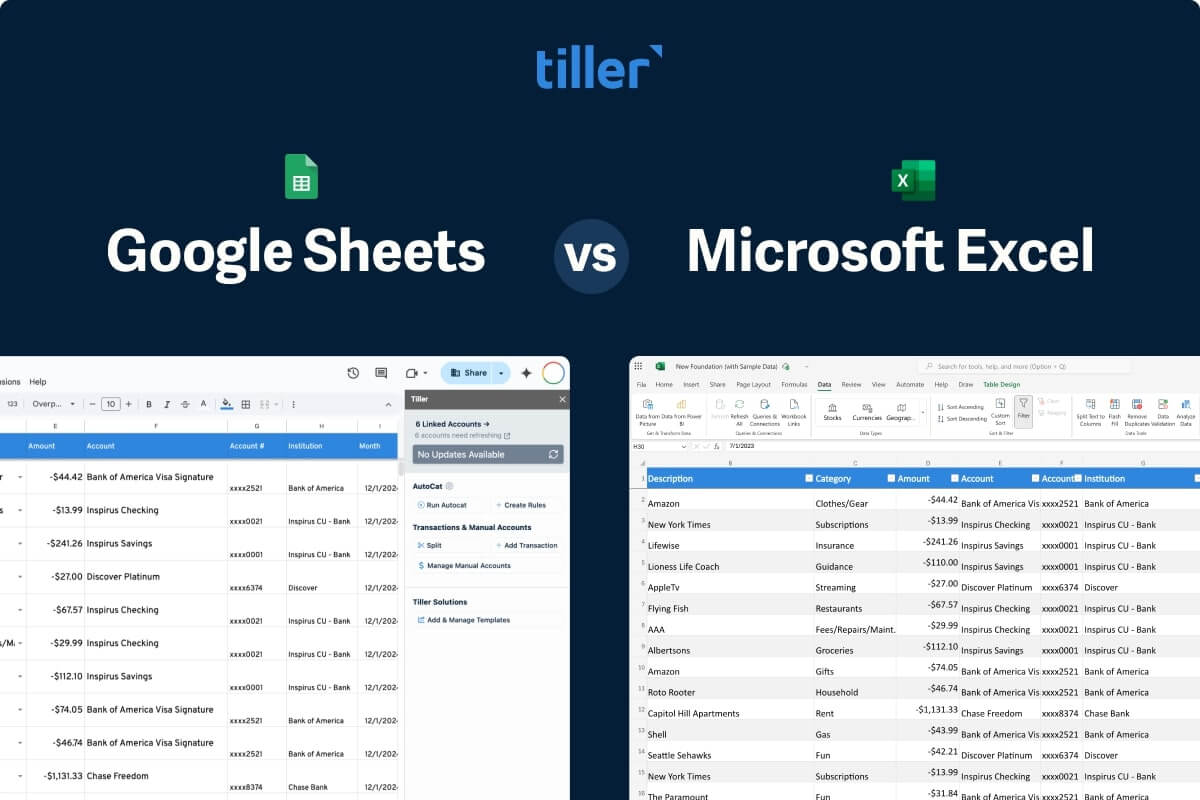
While Google Sheets is fantastic for monitoring your investments, Tiller can supercharge your entire financial life by automatically importing your daily transactions and balances from all your accounts, including checking, credit cards, and loans all into the same spreadsheet.
“There isn’t another tool on the market that does what Tiller can do.” – Will Hinton, Google Review
Keep a clear, confident view of all your money in one place, with flexible templates, powerful privacy, and top-rated support.


