Browse Tiller Community Templates for Report
Or view all templates
Or view all templates

Track spending between paychecks with this template comparing your paycheck amount to expenses before the next check, with options to exclude other income.
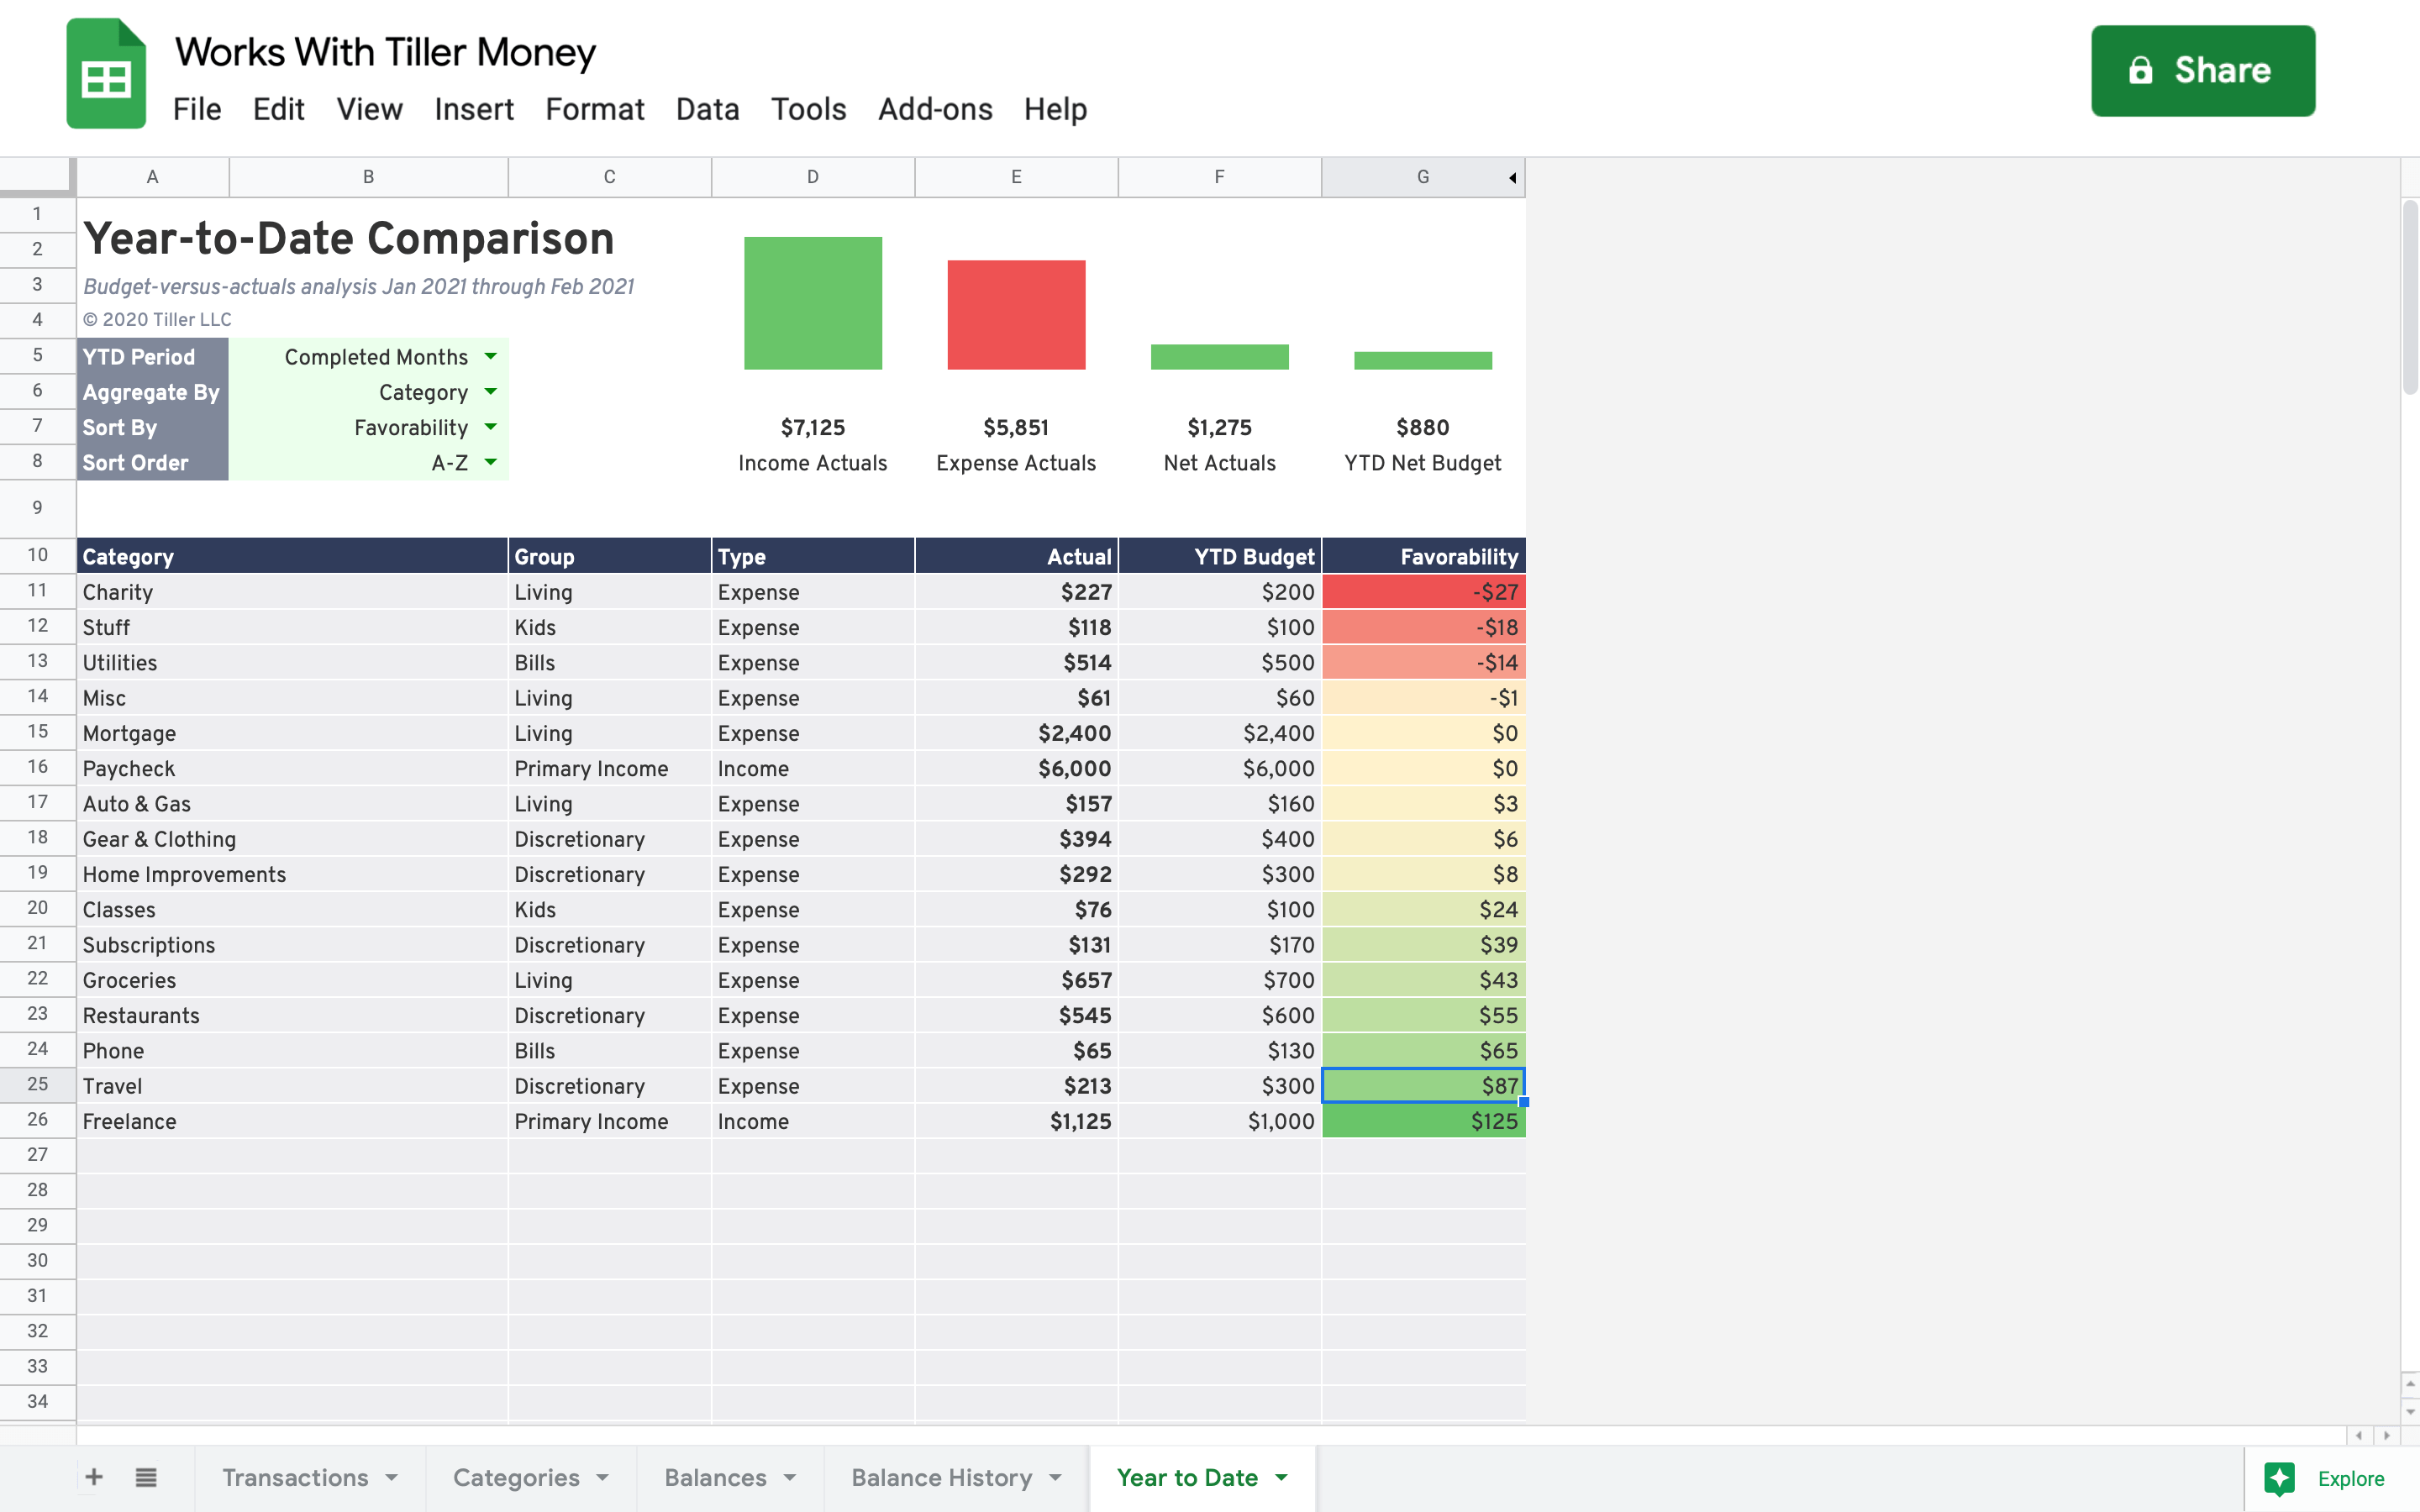
The Year to Date Comparison Spreadsheet provides an analysis of your planned budget versus actuals for the year-to-date period.
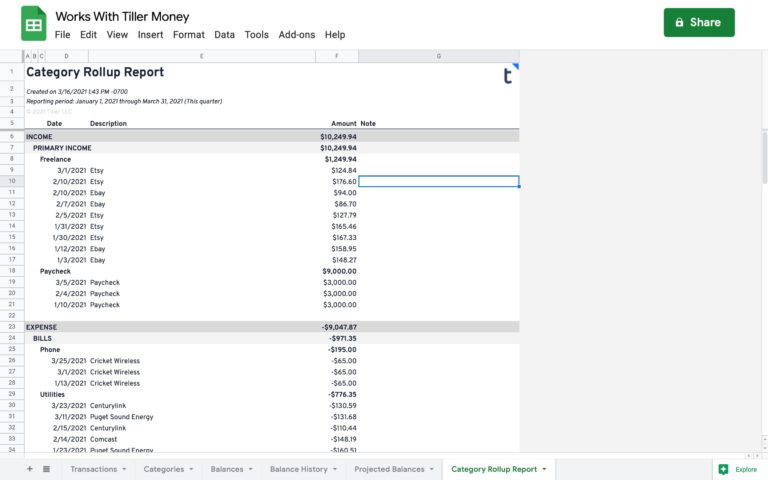
The Category Rollup report organizes your financial data based on details including date, description, amount, and more.
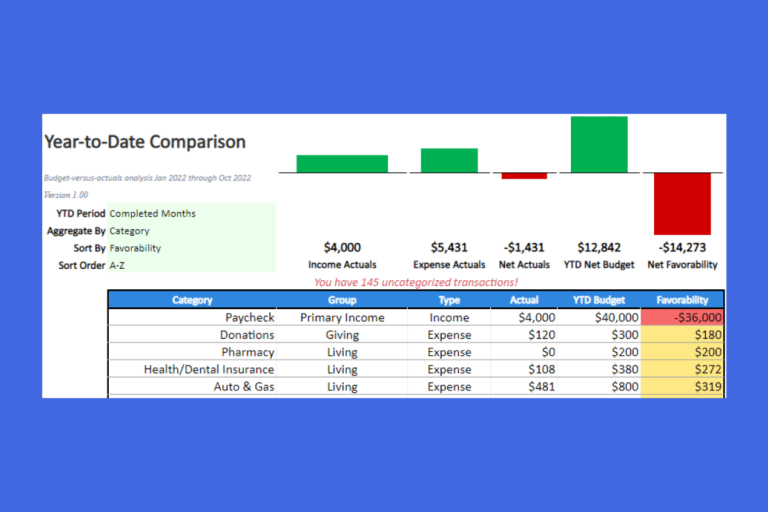
The Year-to-Date Comparison Sheet for Microsoft Excel provides budget versus actual analysis for the year-to-date period. The sheet is very simple and easy to use. It works for the current year.
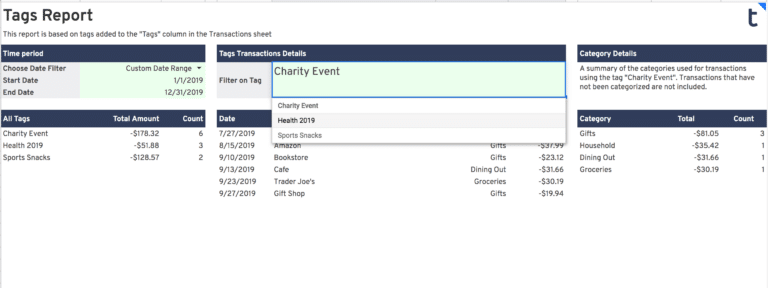
Add a Tags column to your Tiller-powered Google Sheets to organize your transactions with greater precision.
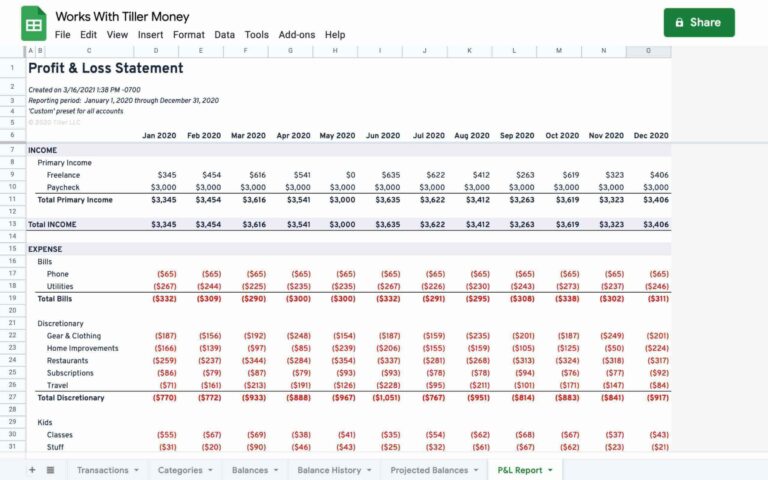
Easily generate a profit and loss report in your Tiller-powered Google spreadsheets.
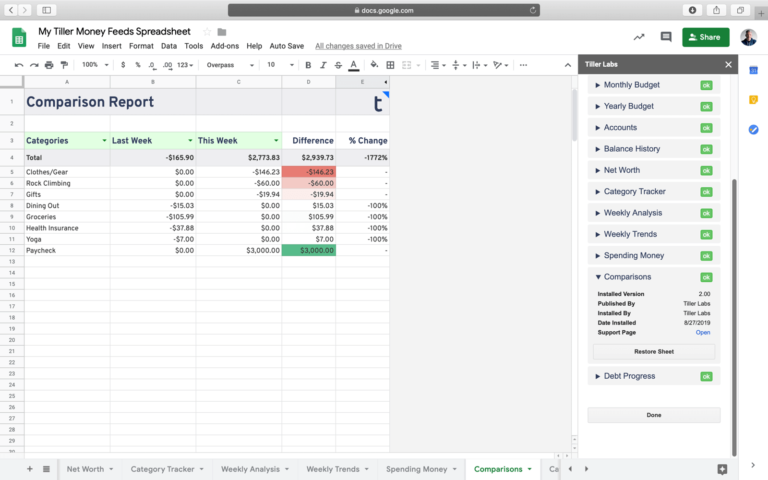
Easily compare your actual spending by category from two time periods of your choosing.
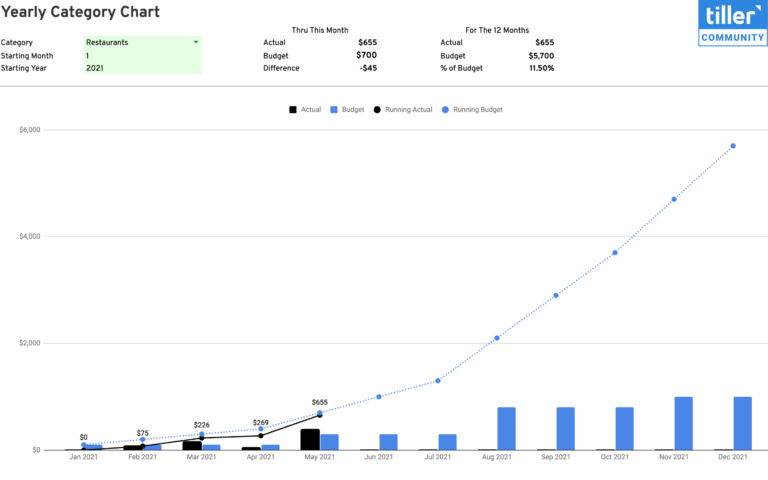
See a chart of your actual vs budget for a single category over the course of a year.
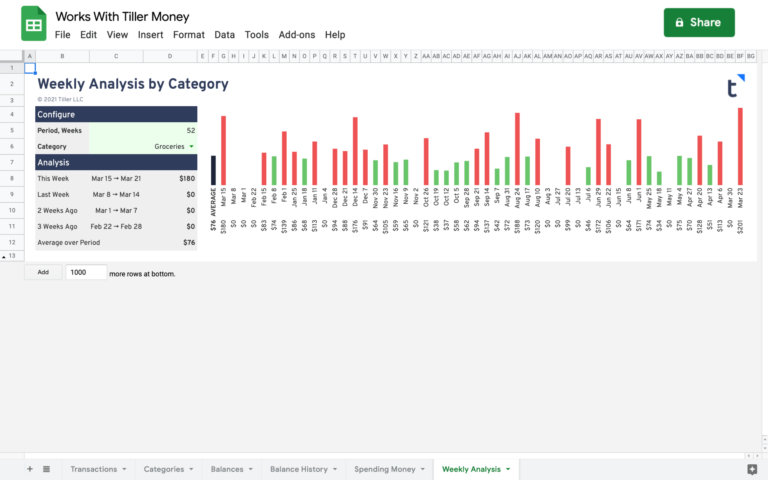
Quickly see how much you’ve spent in a specific category over a customizable number of weeks with the Weekly Analysis sheet.
The Paycheck Deductions Tracker is an easy way to generate transactions based on the deductions taken from your paycheck so you have better insights into where your money is going.
Build a pie chart visualizing your spending and income over a completely customizable date range with the Category Tracker Report for Google Sheets.
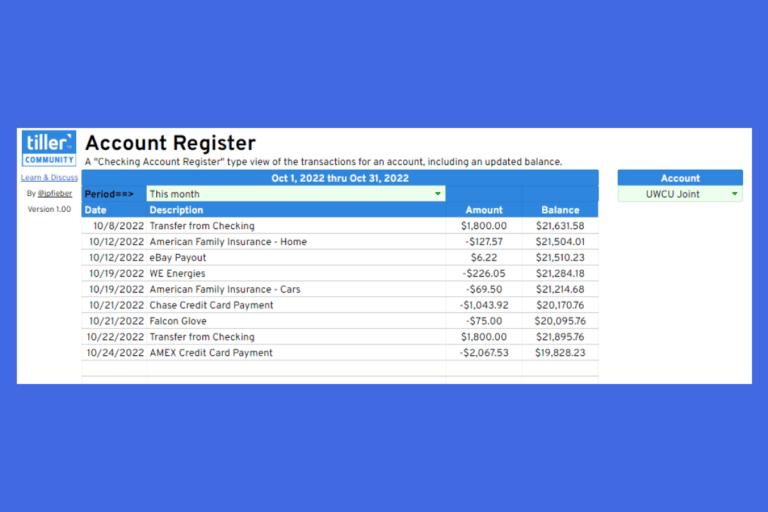
Similar to a virtual checkbook for Microsoft Excel, the Account Register shows a running balance of your accounts and includes each transaction's date, description, and amount.