

About the Category Tracker Report
The Category Tracker Template is a powerful yet simple way to understand your spending and cash flow over a configurable time period. It’s one of the most popular Tiller Community templates.
Using the Category Tracker Report
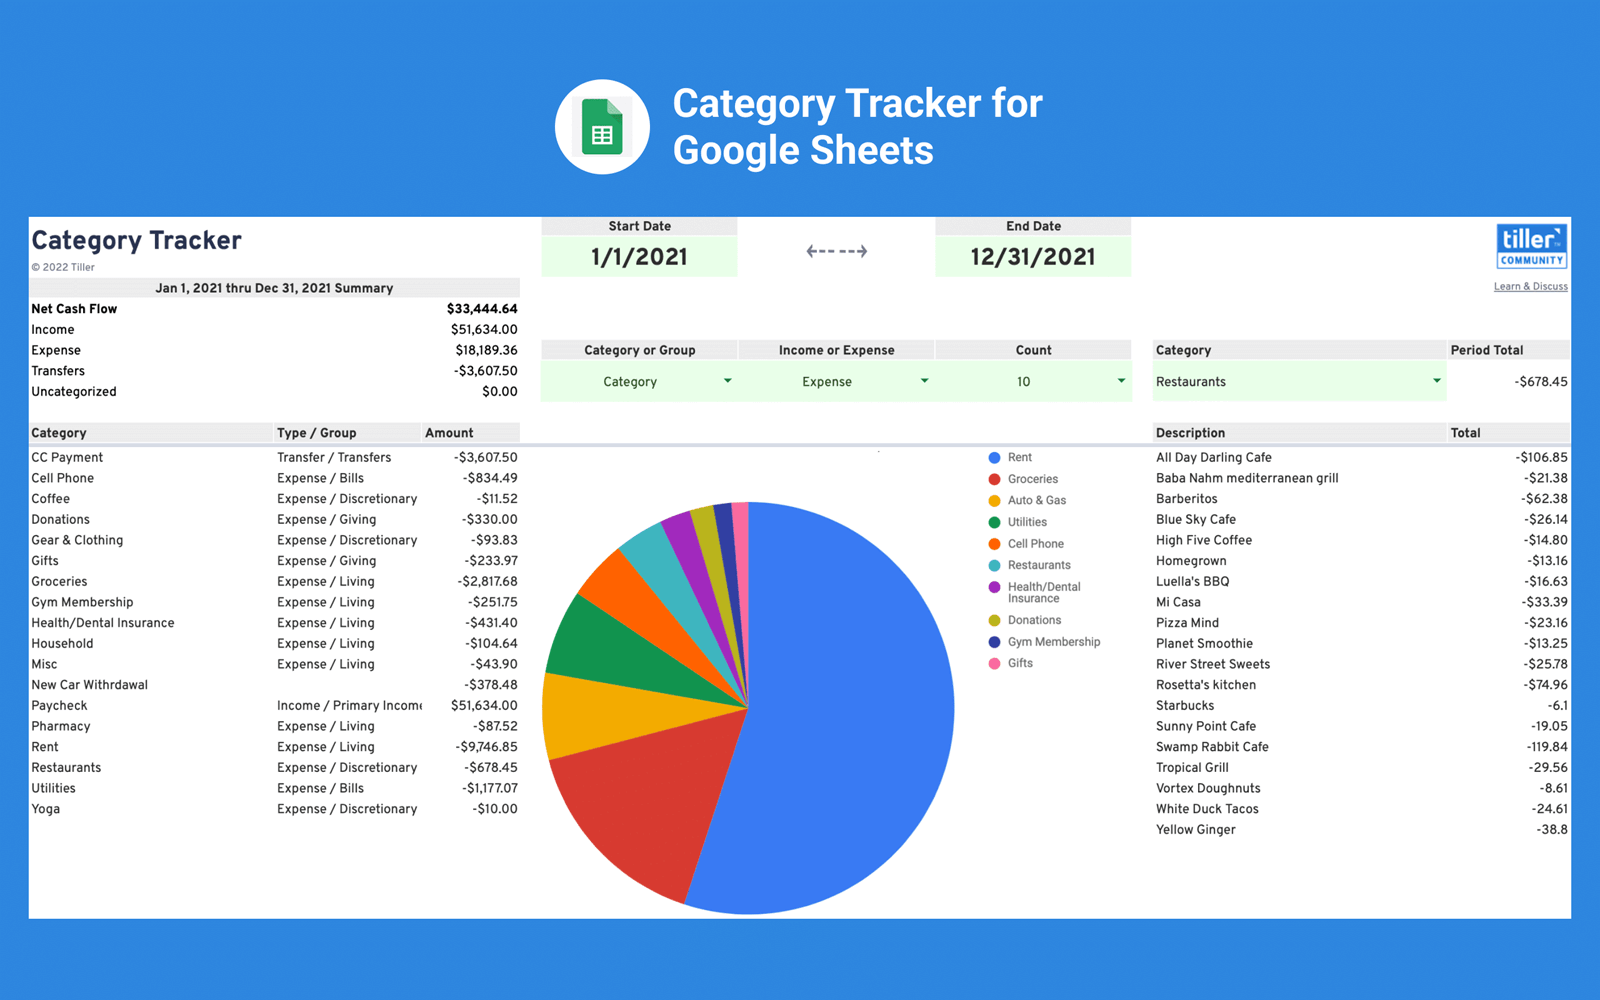
Use this template to build a pie chart visualizing your spending and income in each of your transaction categories over a customizable date range.
The template also lists your category totals, income, expenses, transfers, and net cash flow for your selected time period.
Installation
This template requires a free trial or active subscription of Tiller to try.
- Launch Tiller Money Feeds
- Under Templates near the bottom, click Browse
- Find the template in the list using search or scroll to find it
- Click the template name in the list to expand its card
- Click Install to add the template to your spreadsheet
- Read more in the Tiller help center
Support & Documentation
View documentation for the Category Tracker Report here the Tiller Community