
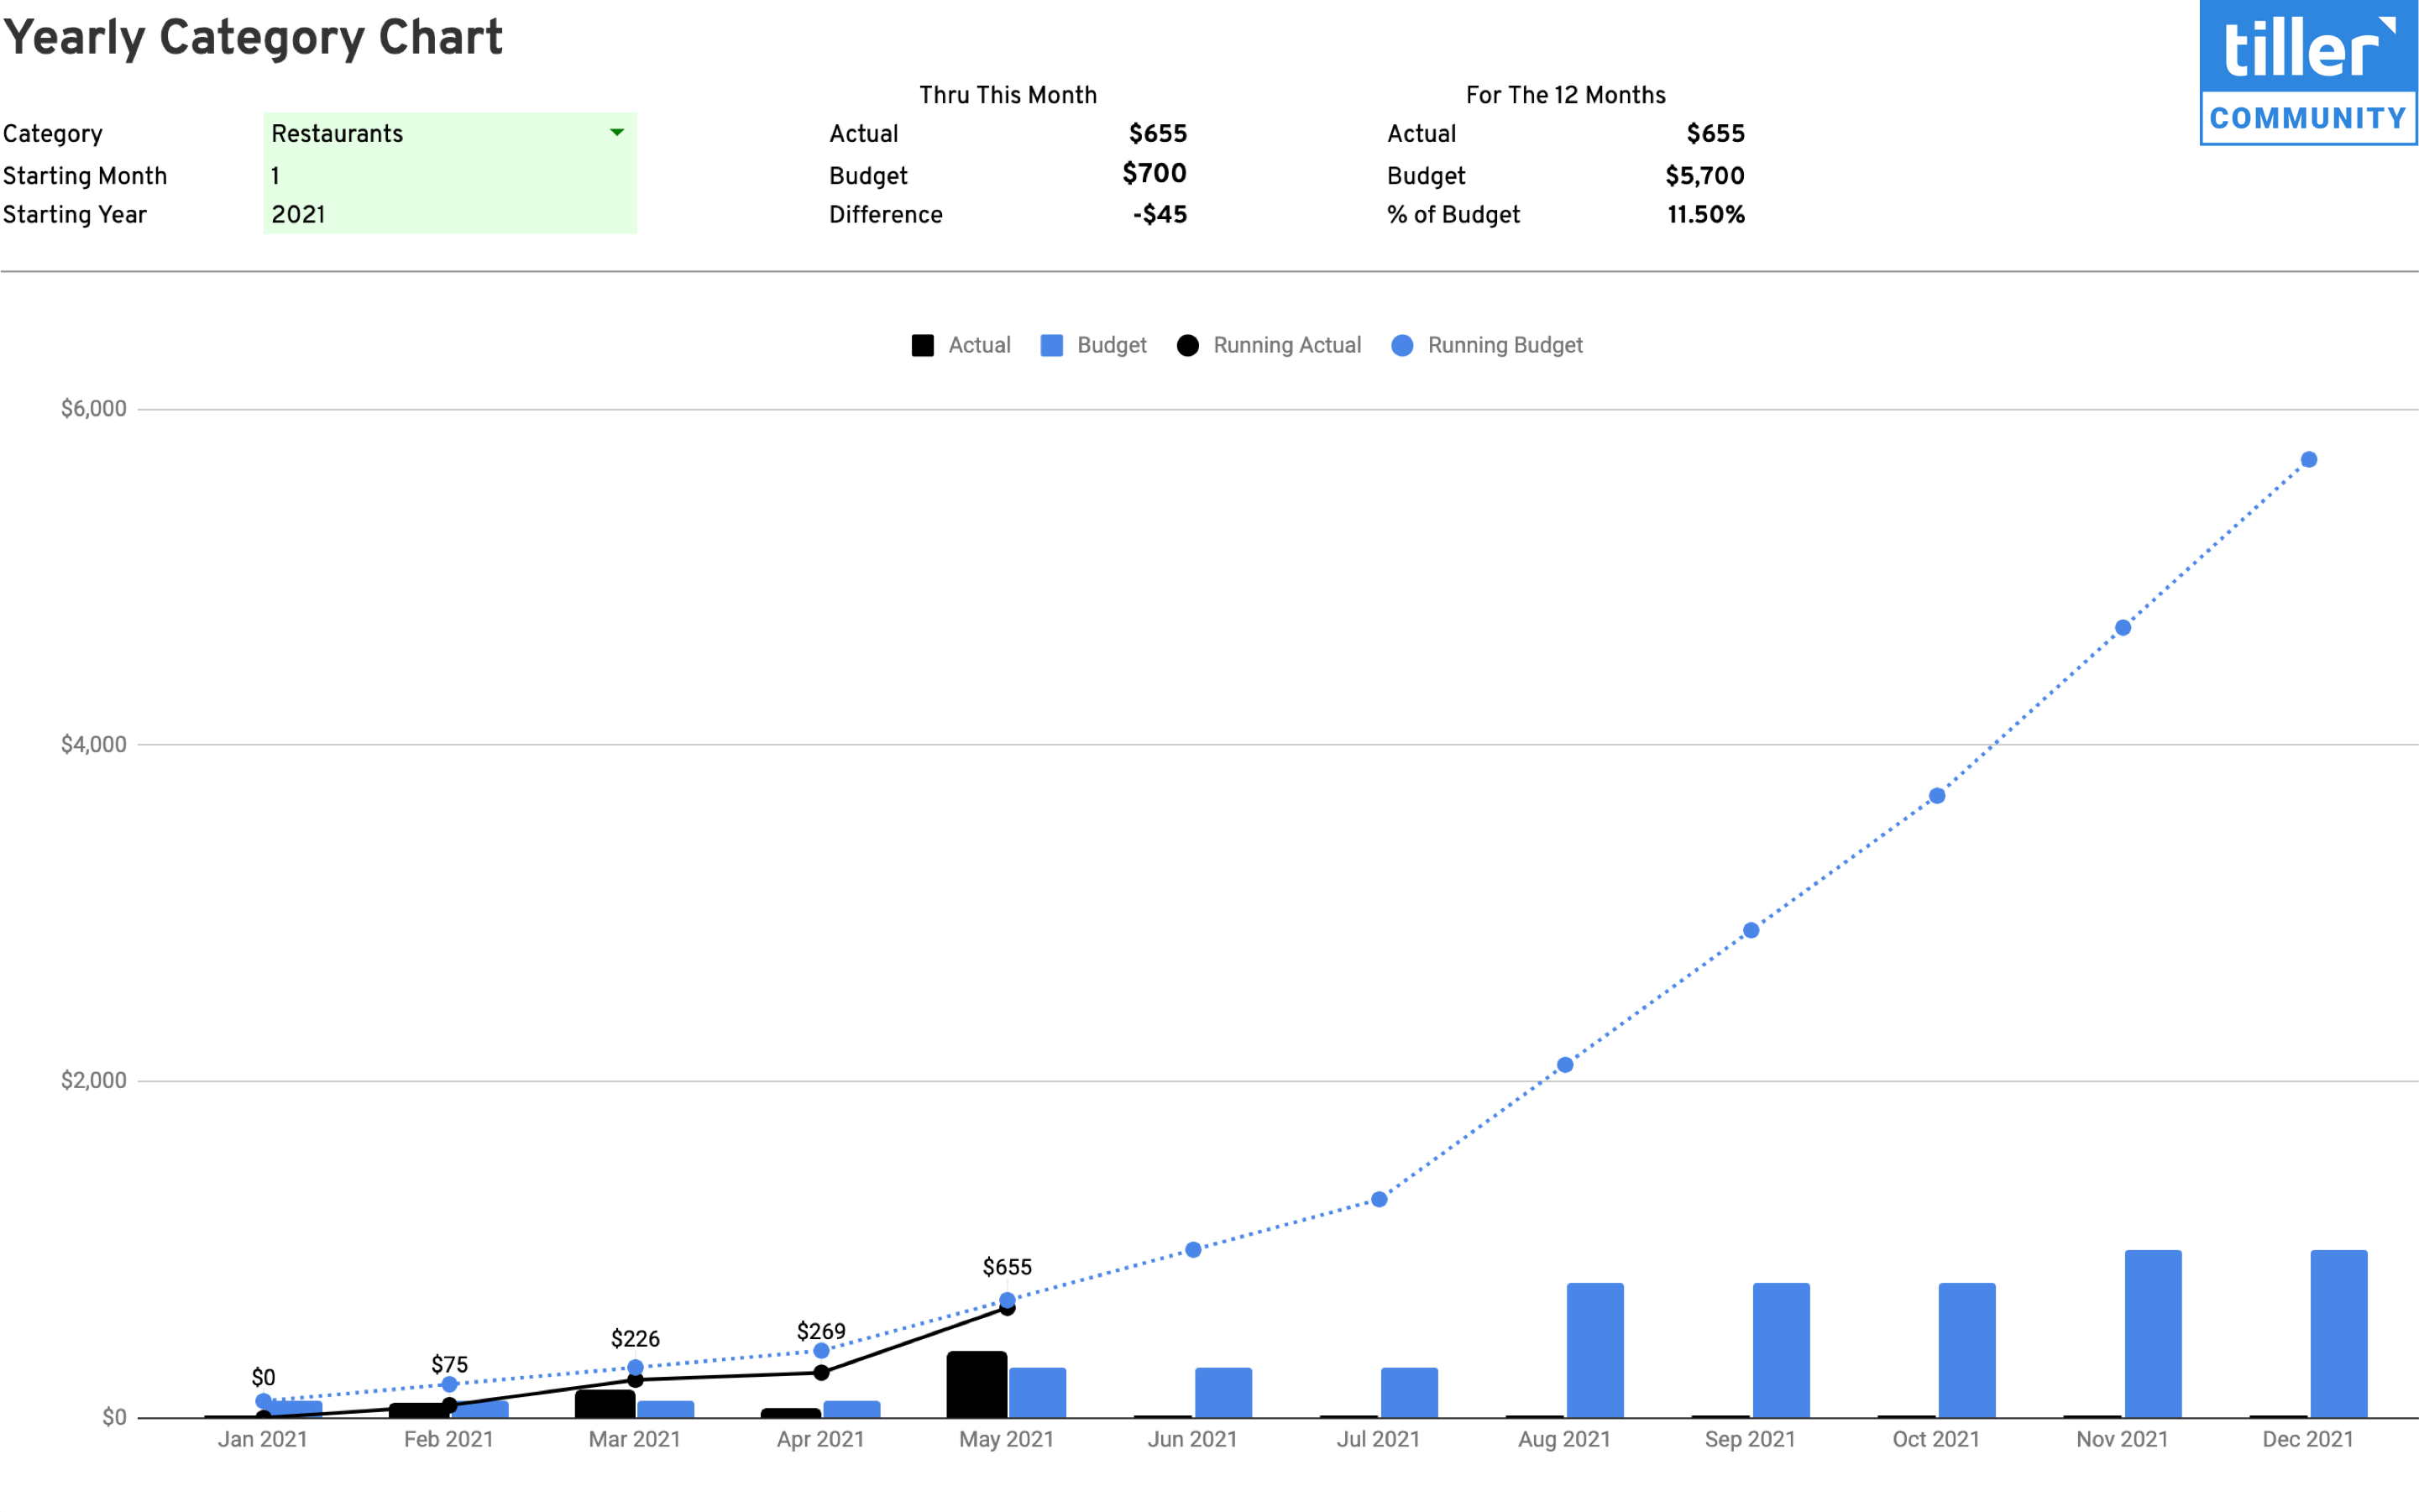
Yearly Category Chart
See a chart of your actual vs budget for a single category over the course of a year.

About the Yearly Category Chart for Google Sheets
This sheet shows you a chart of your actual vs budget for a single category over the course of a year. For non-regular categories which vary from month to month, this sheet gives a quick visual representation of how you’re doing.
Support & Documentation
- View documentation for the Yearly Category Chart here the Tiller Community
- All Tiller Community Solutions are exclusively supported in the Tiller Community
Powered by Tiller
This template is designed for spreadsheets powered by Tiller, the only personal finance service based on Google Sheets and Microsoft Excel.
The best way to use this template is by trying Tiller free for a month. Your card isn't charged until the end of your trial, and you can easily cancel anytime. Any data and templates you download during your trial are yours to keep.