Tiller Community Templates Gallery
Browse free templates for spreadsheets powered by Tiller.
Browse free templates for spreadsheets powered by Tiller.
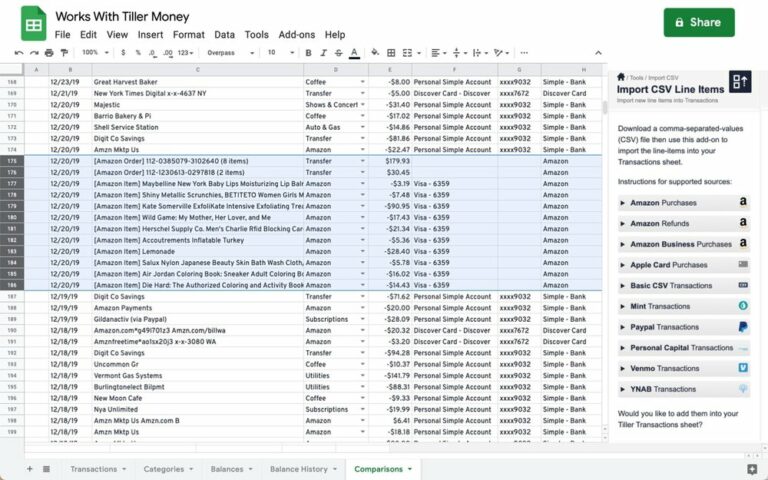
The CSV Importer cleanly imports Amazon spending reports, Venmo, Paypal, Apple Card, YNAB, Mint and other CSV data directly into Google Sheets powered by Tiller
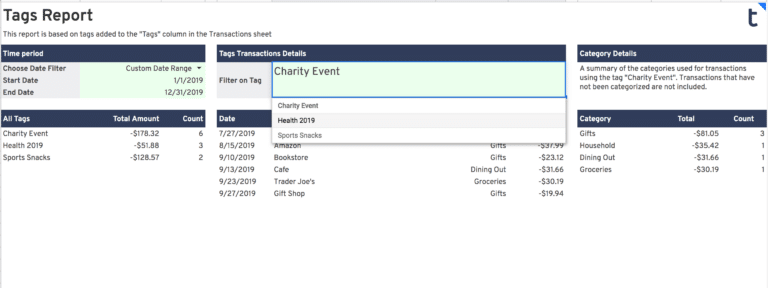
Add a Tags column to your Tiller-powered Google Sheets to organize your transactions with greater precision.
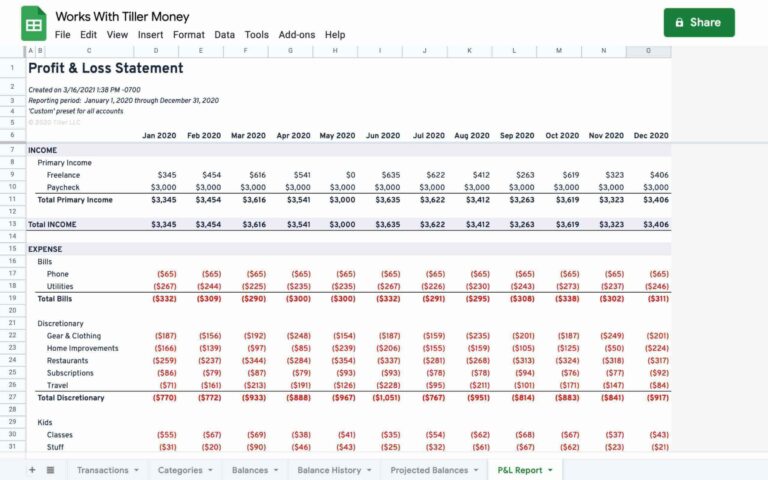
Easily generate a profit and loss report in your Tiller-powered Google spreadsheets.
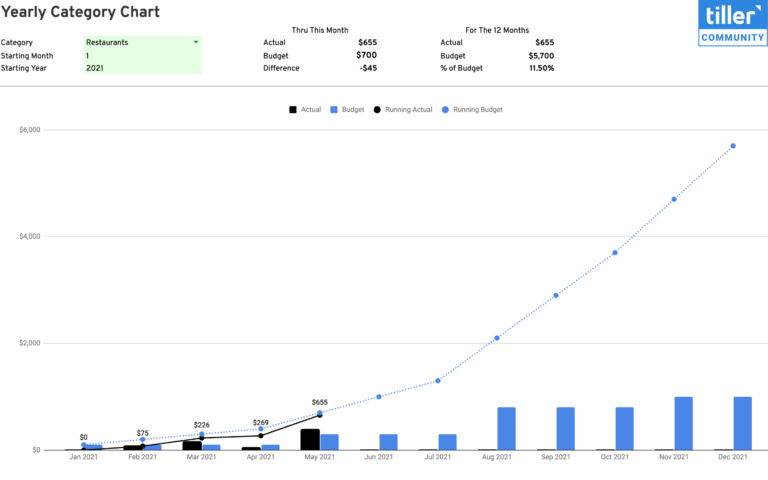
See a chart of your actual vs budget for a single category over the course of a year.
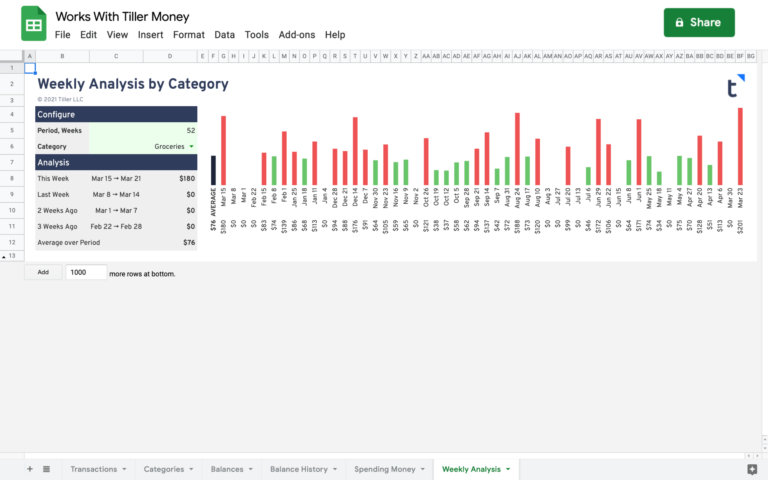
Quickly see how much you’ve spent in a specific category over a customizable number of weeks with the Weekly Analysis sheet.
The Paycheck Deductions Tracker is an easy way to generate transactions based on the deductions taken from your paycheck so you have better insights into where your money is going.
Build a pie chart visualizing your spending and income over a completely customizable date range with the Category Tracker Report for Google Sheets.
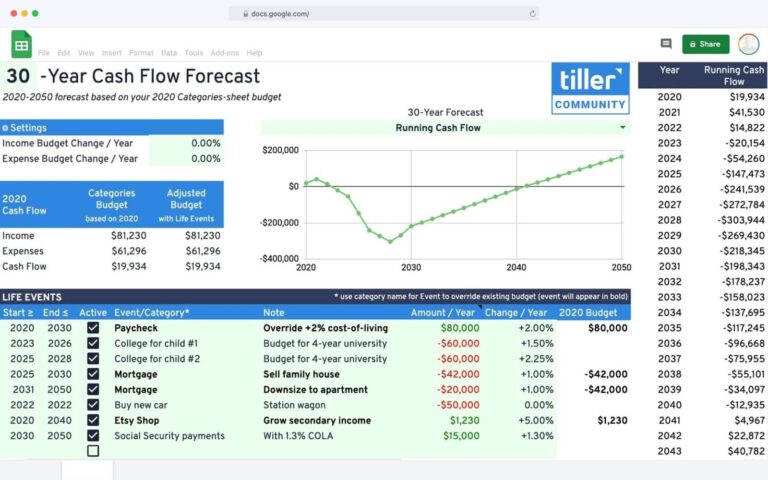
Forecast your cash flow into the future. Test different income/expense scenarios and view the impact of those changes over the long term.
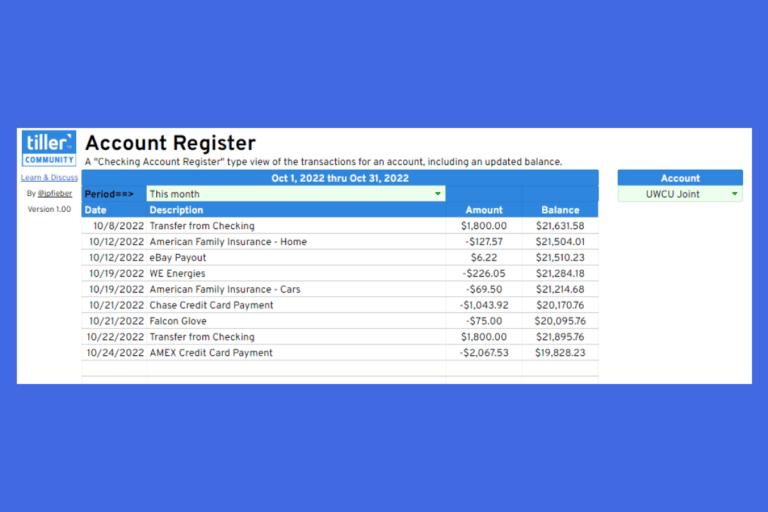
Similar to a virtual checkbook for Microsoft Excel, the Account Register shows a running balance of your accounts and includes each transaction's date, description, and amount.
Build a pie chart visualizing your spending and income over a completely customizable date range with the Category Tracker Report for Microsoft Excel.
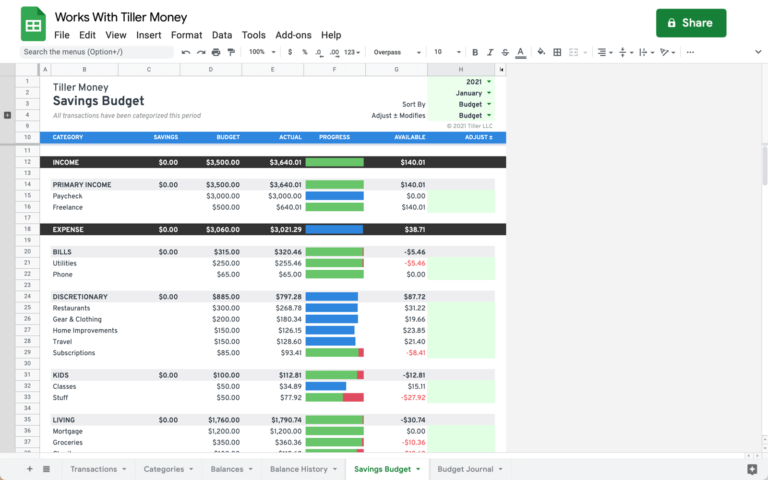
The Savings & Debt sheet allows you to set, manage and track your savings and debt goals atop the Savings Budget template.

A simple envelope/rollover savings budget template for Google Sheets.