About the Yearly Spending Insights Spreadsheet
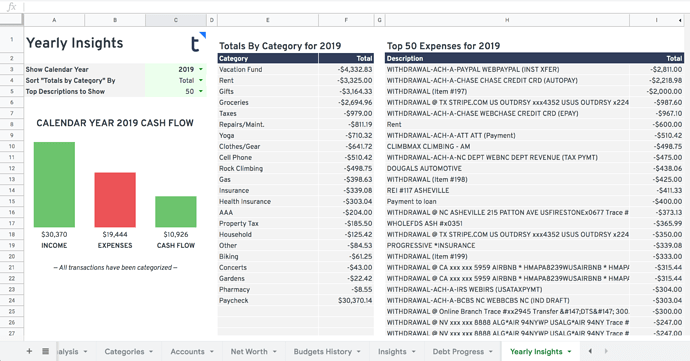
The Yearly Spending Insights sheet gives you a bird’s-eye view of your finances, either for the full previous year or current year-to-date. At a glance, you can see total earnings, total spending, and a breakdown of where your money actually went across every category.
It’s especially useful at year-end when you want to reflect on your spending patterns, spot categories that crept up, or set targets for the year ahead. Unlike month-to-month views, the annual summary makes trends easier to see and harder to ignore.
The sheet pulls from your Tiller transaction data automatically. You can customize which year you’re viewing, sort the category summary by total amount or alphabetically, and adjust how many top spending descriptions are displayed.
Best for: Tiller users who want a year-end financial review or want to spot spending trends across categories over time.
Support & Documentation
Install Yearly Insights through the Tiller Community Solutions add-on: find it under the Analysis tag in the Explore tab. For setup details, customization tips, and community discussion, visit the Yearly Insights page in the Tiller Community. If you run into an issue, search the community first and if your question hasn’t been answered, post it in the Get Help > Spreadsheet Templates category.


Start the discussion at community.tillerhq.com