
At Tiller, we’re incredibly excited about the new wave of AI-powered tools that help people understand and, more importantly, benefit from the insights locked within their spreadsheets.
While AI is always optional with Tiller, and we’ll always support human spreadsheet builders, you no longer need extensive spreadsheet skills or experience to create custom tools that answer your money questions and track your goals.
There are already dozens of ways to connect AI to spreadsheets. Google’s new Sheets Canvas is one of the most exciting AI tools we’ve seen so far.
Our team is using it extensively, both at Tiller and at home.
About Google Sheets Canvas
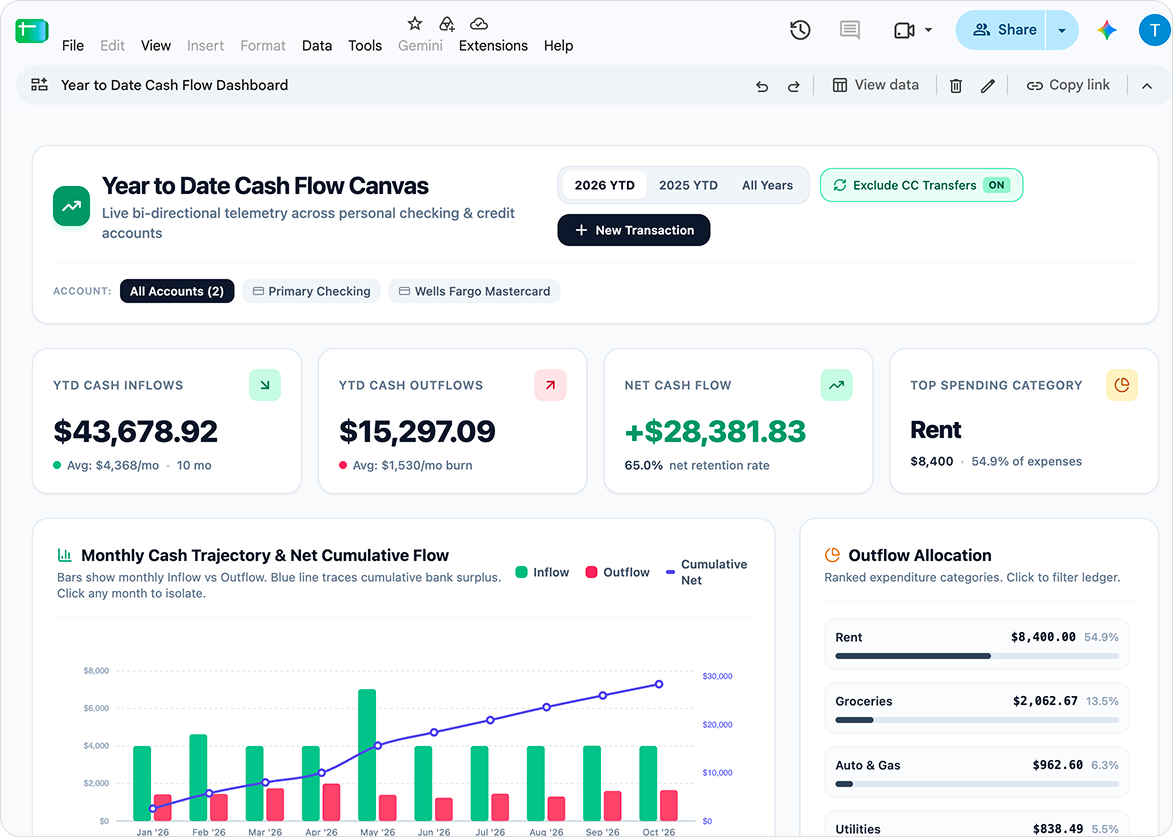
Sheets Canvas is a new feature built with Gemini. With a natural language prompt, Sheets Canvas can transform Google spreadsheets into custom, visual, interactive mini-apps and dashboards that are easy to understand and use.
No formulas or programming required.
“We designed Sheets canvas to be as flexible as your imagination.” –Google Blog
The main drawback with Sheets Canvas is its current availability, limited to users with Google AI Pro and Ultra plans (starting at $19.99), and Google Workspace Business and Enterprise Standard and Plus plans.
If you use a personal Google account, Google says you “might be able to use Canvas and Build up to 3 times a month” through Workspace Experiments.
Hopefully, this tool becomes part of the less expensive Hopefully, this tool becomes part of the less expensive Google One AI plans, which start at $4.99.
Another limitation is that Sheets made with Canvas aren’t yet natively viewable on mobile, though workarounds exist, as shown in the demo below.
The build, step by step
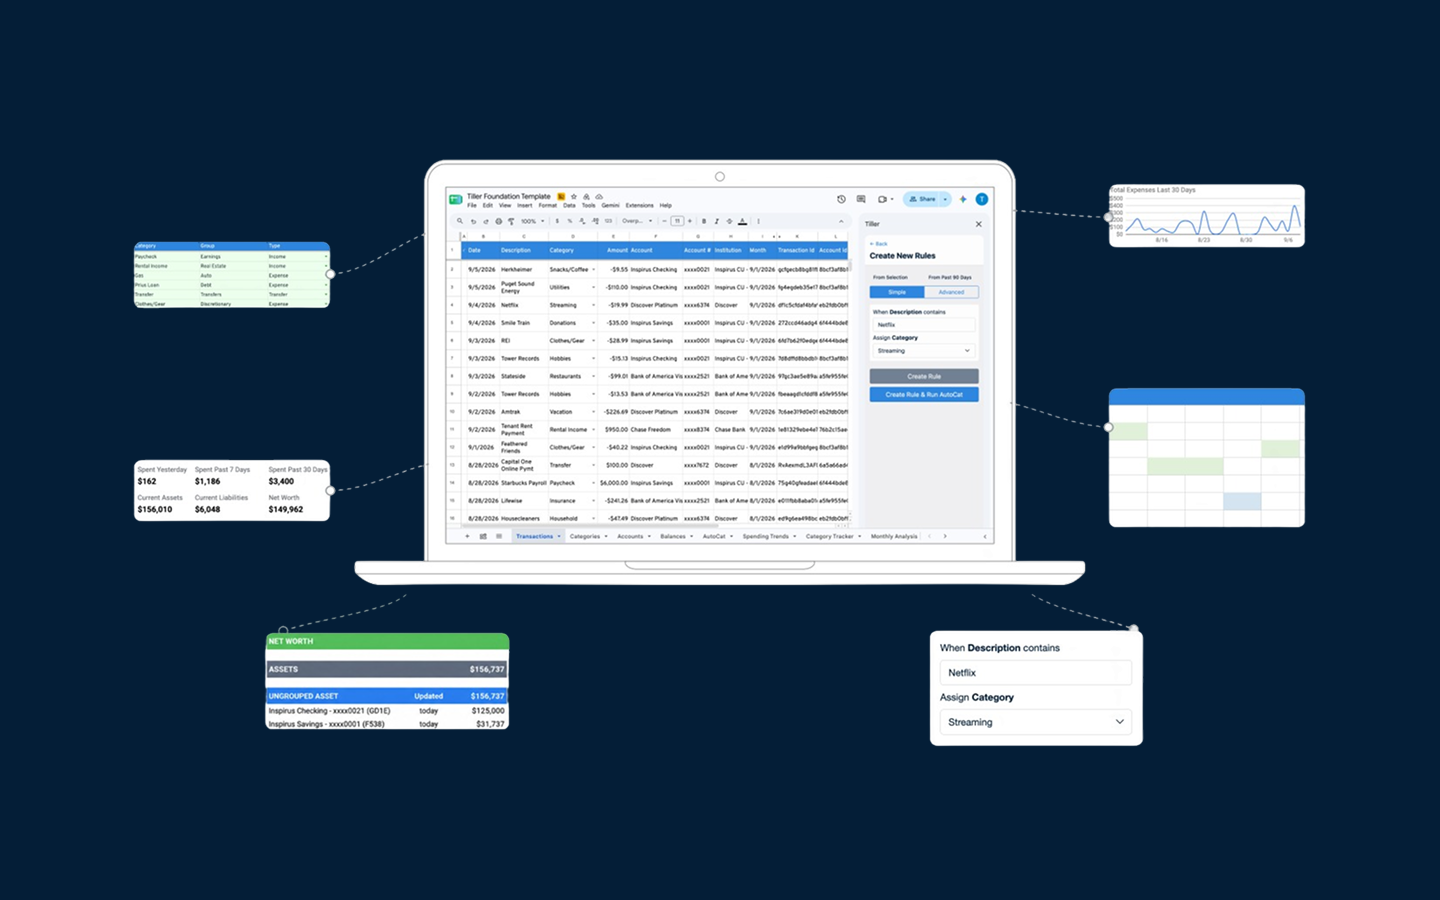
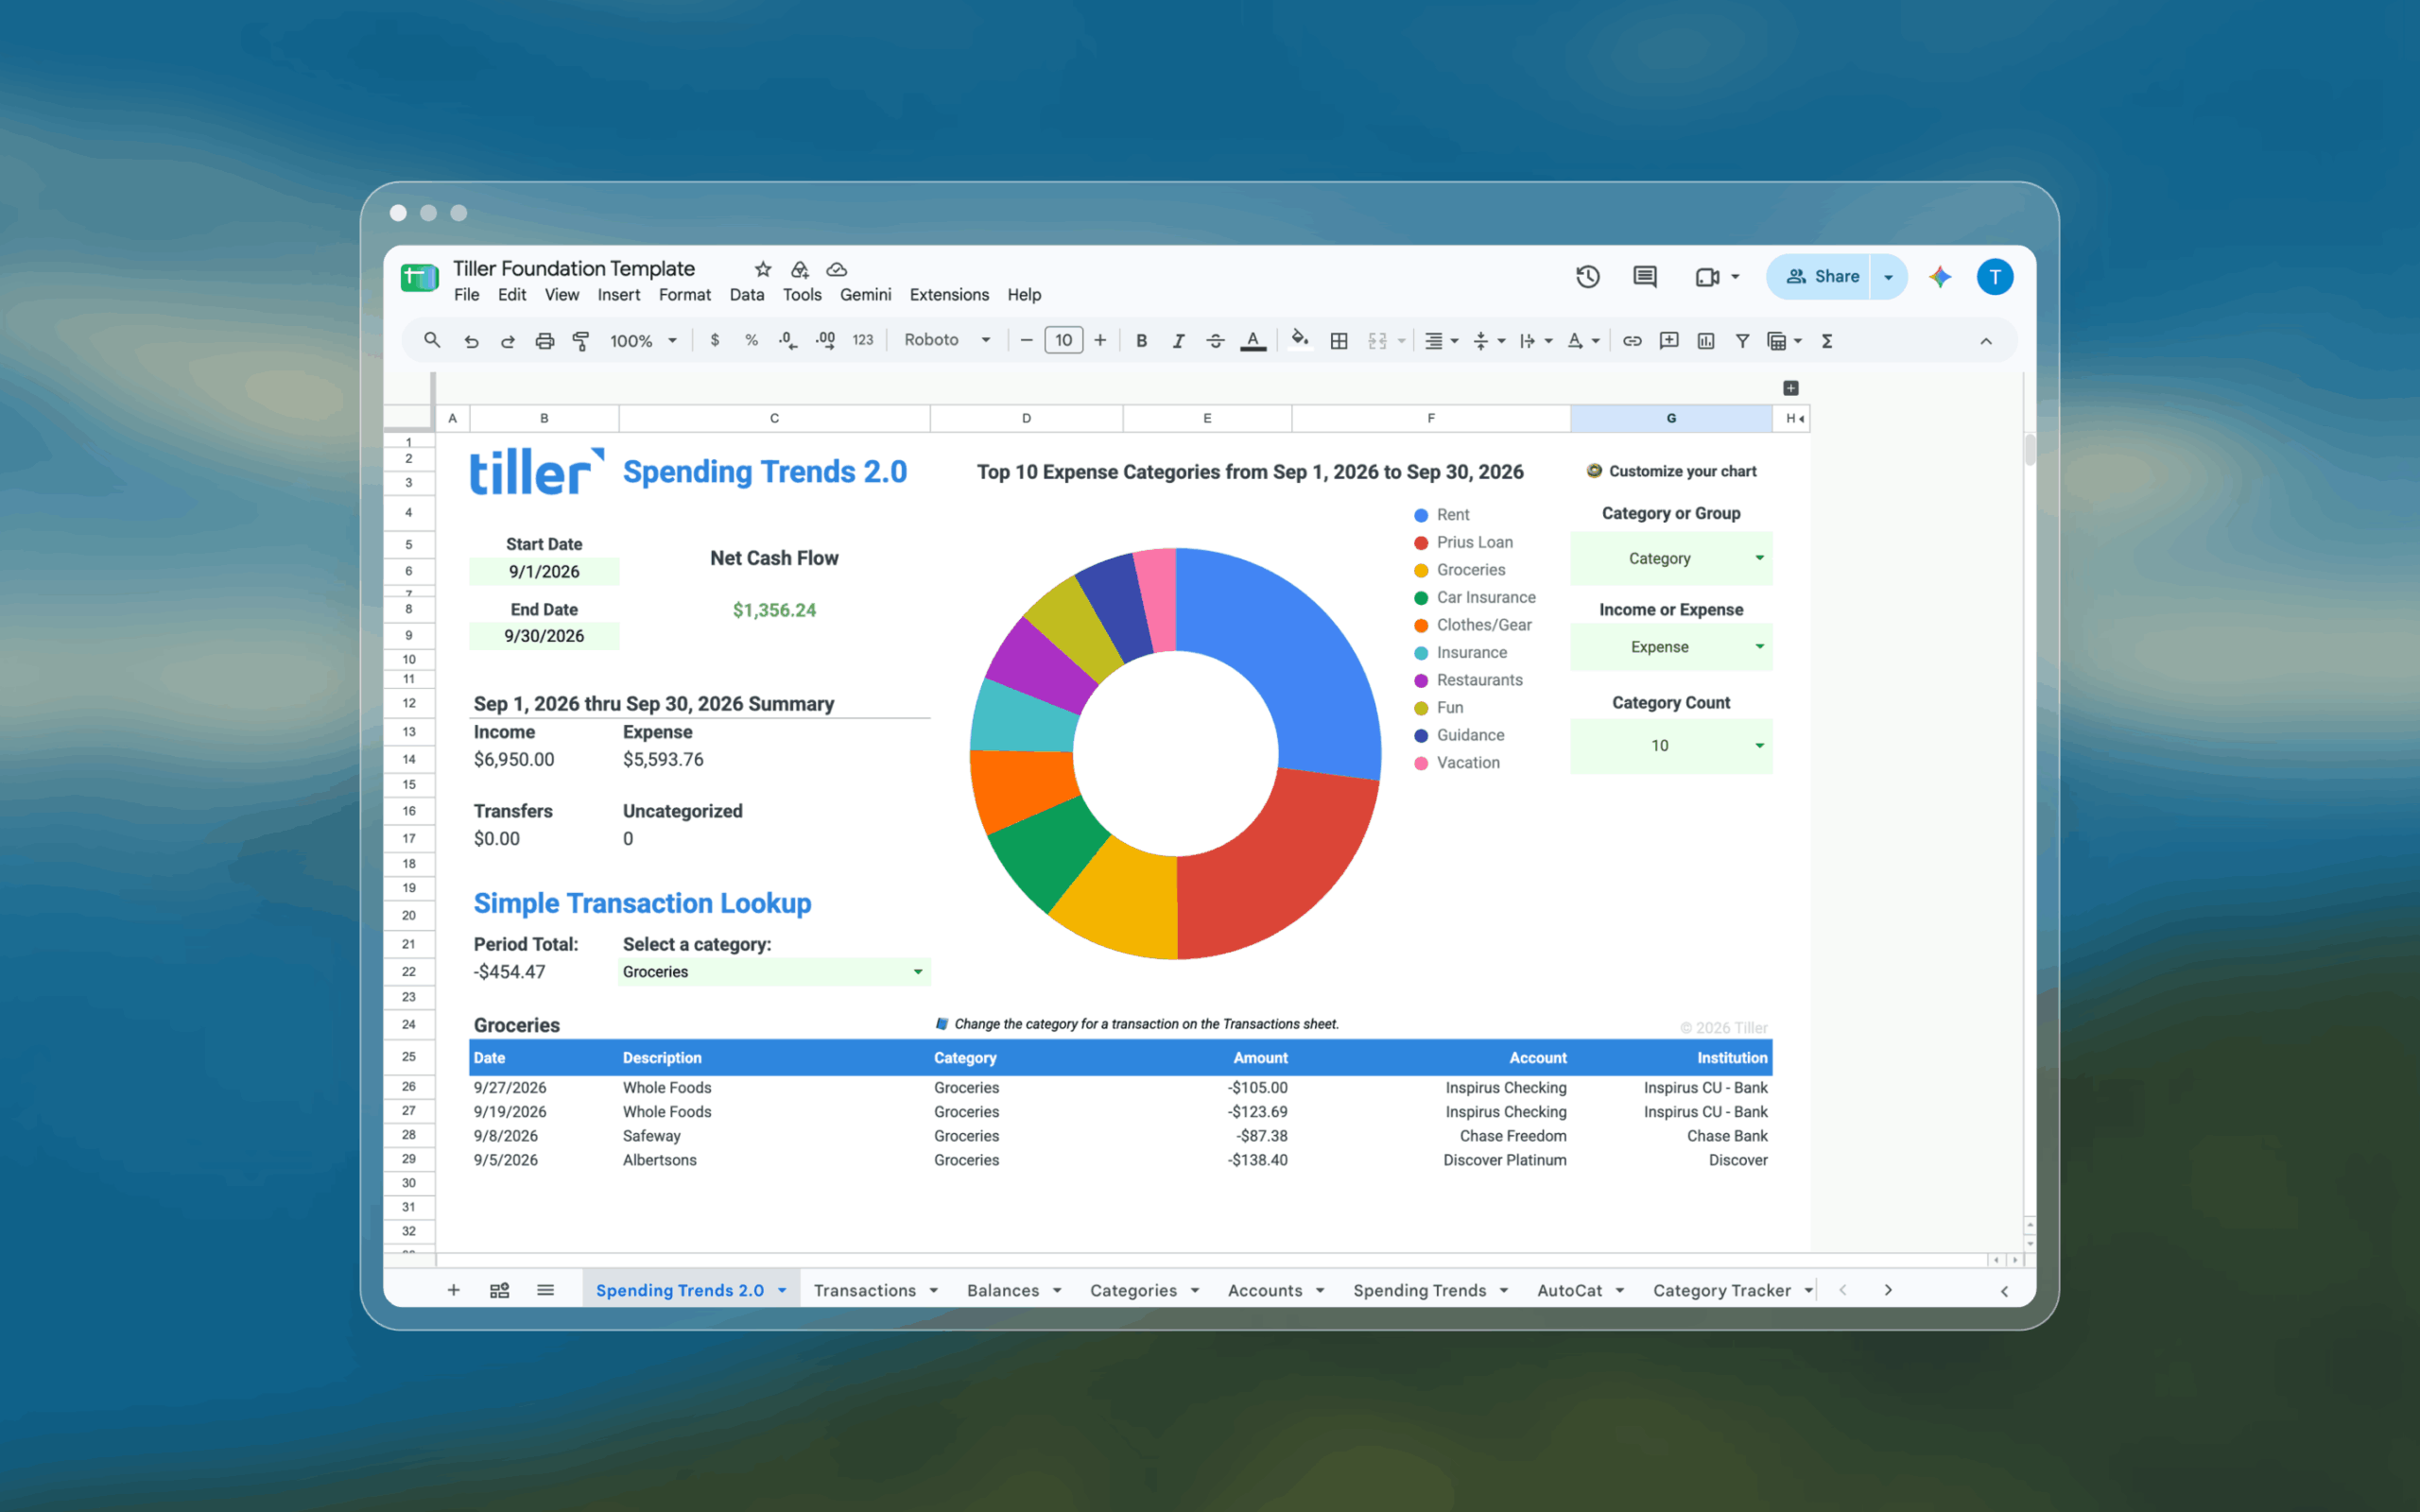
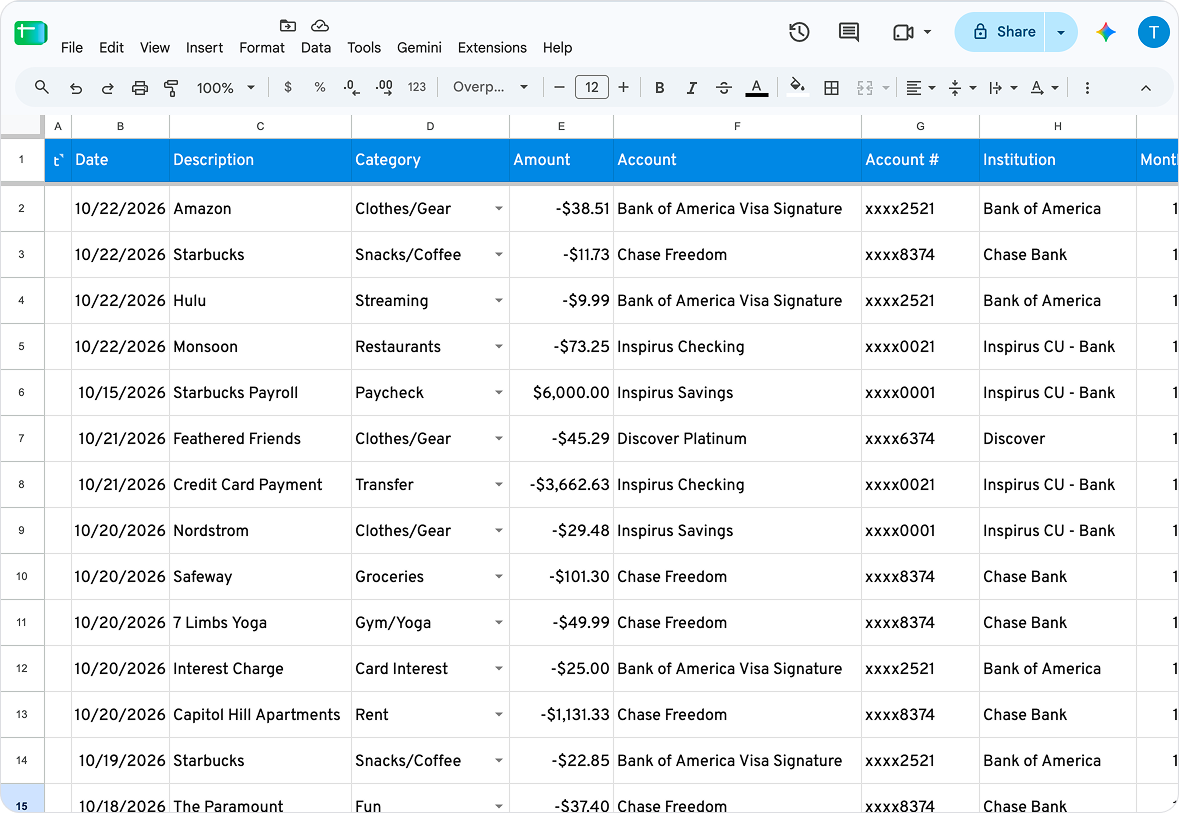
I started with a standard Tiller Foundation Template in Google Sheets. The Foundation Template is ideal for extending with AI because of its clean content structure and strictly organized Transactions, Balances, Balance History, and Categories sheets.
From those core sheets, you can build endless dashboards, reports, and apps.
1. The build started with an emergency fund tracker
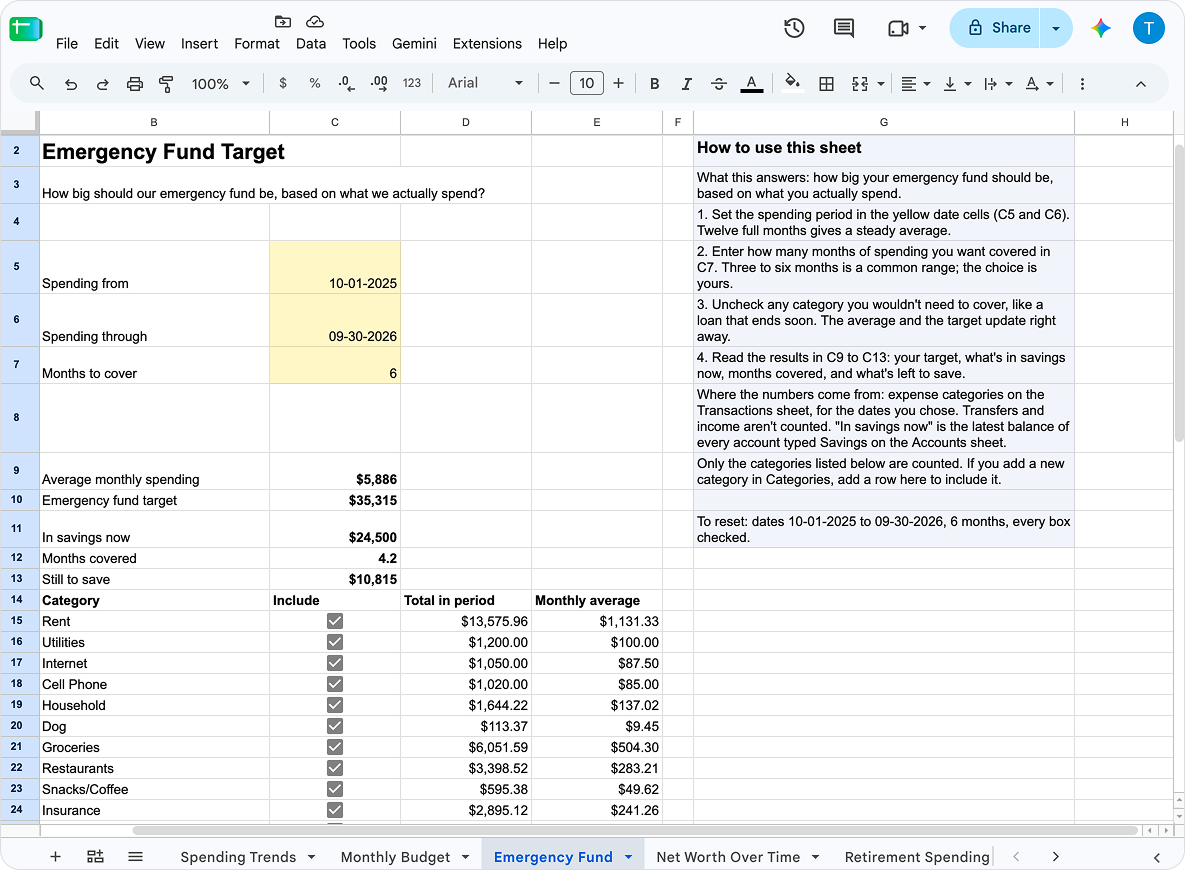
Before the session, I asked Gemini in Google Sheets to read my Foundation Template and create a simple tracker for a household emergency fund, based on my actual spending.
The sheet averages my monthly spending from the Transactions sheet and reads the savings balance from the Accounts sheet. It shows my saving target, months I’ve already covered, and what’s left to save.
Super useful! And boring.
2. Ask Canvas to “Create a dashboard”
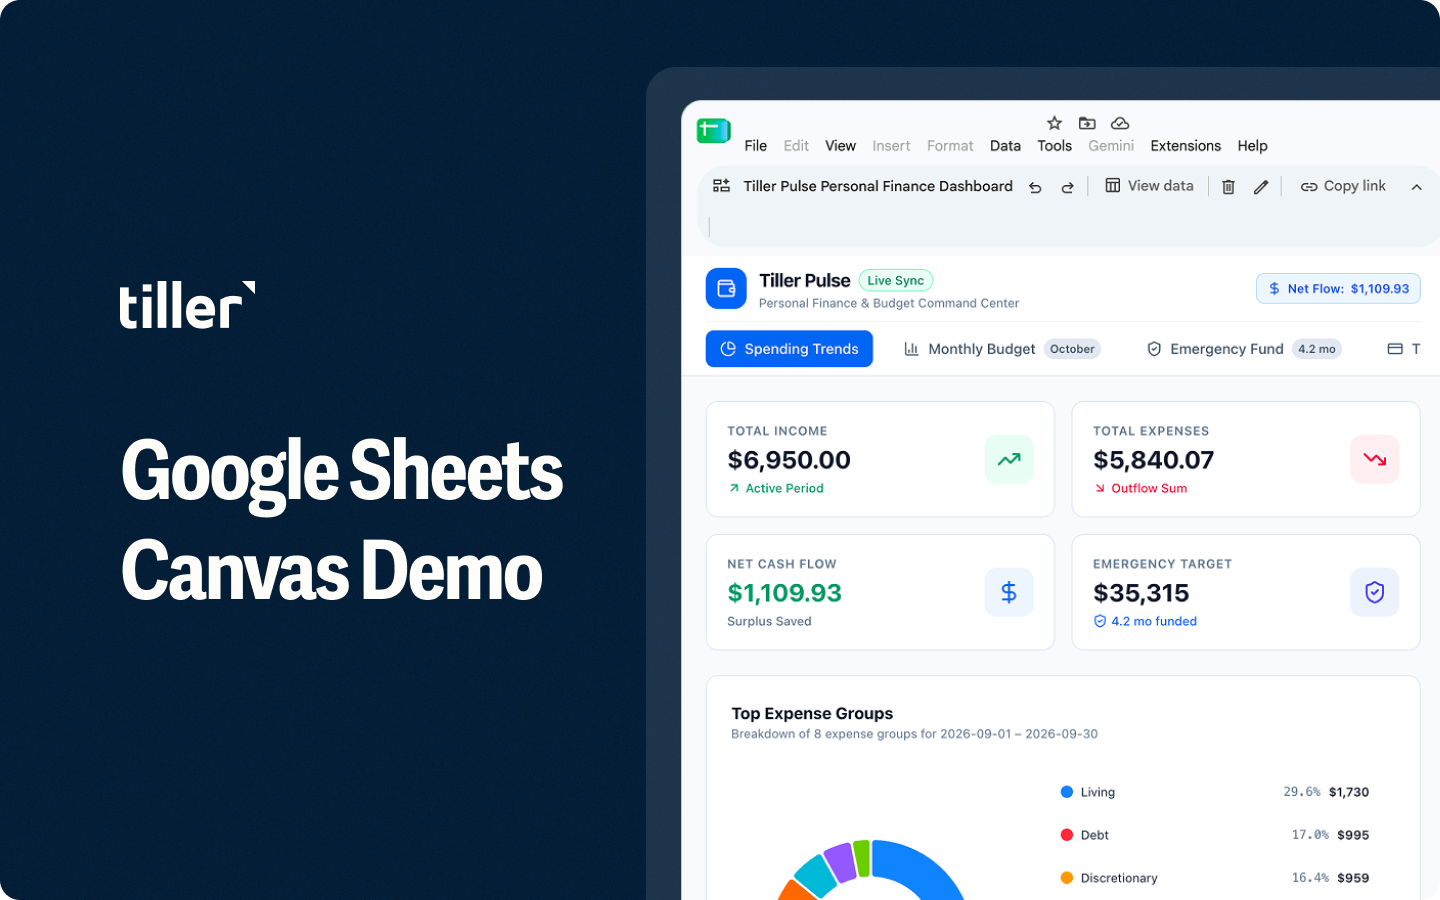
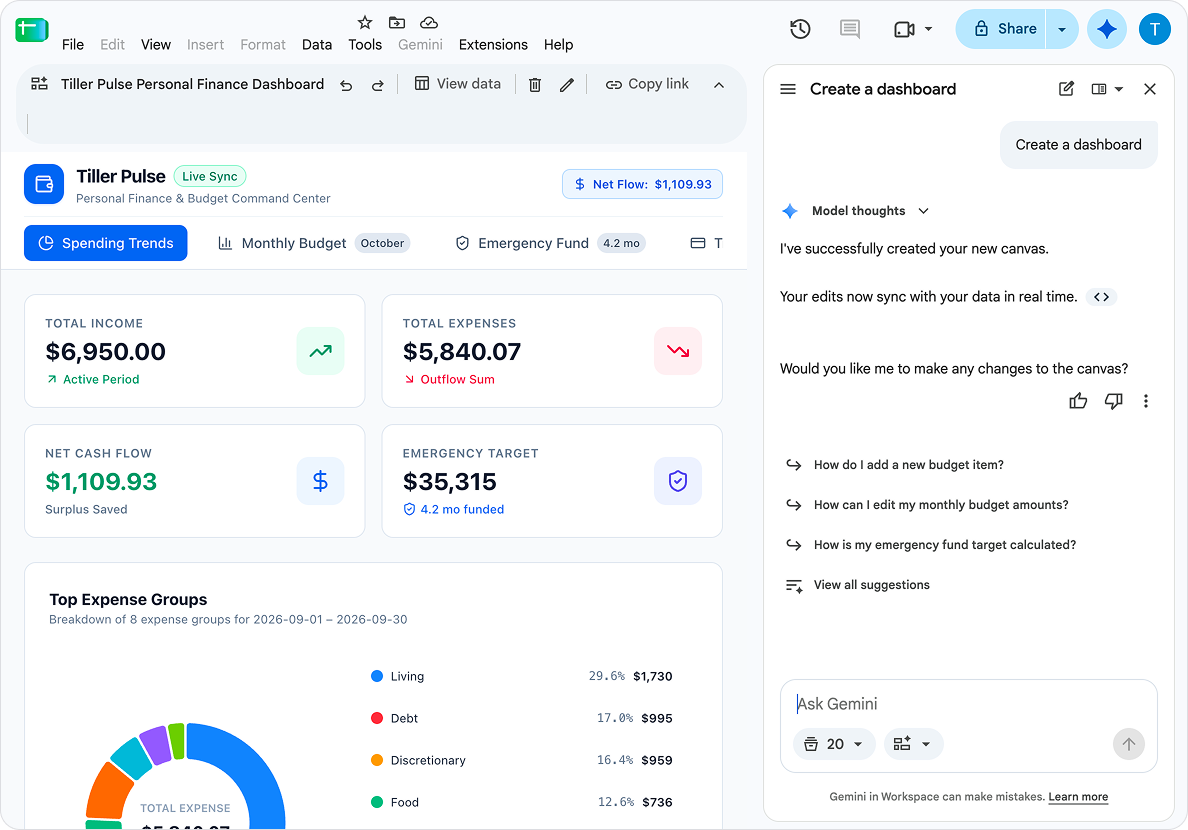
I then opened the Gemini panel and typed “Create a dashboard.” Gemini built Tiller Pulse, a canvas with tabs showing my spending trends, monthly budget, and my new emergency fund.
I didn’t actually ask Gemini to include the Emergency Fund; it folded it in on its own.
Every number on this canvas comes from sheets in the same spreadsheet. It’s just a way of looking at that data.
3. Ask for an alert
A cool and useful dashboard is useful. A cool and useful dashboard that sends alerts is exponentially more useful, at least for me.
So I asked Gemini how to get alerts from the sheet. Gemini suggested a short Apps Script that checks the spreadsheet once a day and sends an email only when something needs attention.
Gemini’s first version of the script read the wrong columns and would have flagged paychecks as large charges. I learned this when I double-checked the script with Claude. Gemini would have caught it on a follow-up, but I’m in the habit of checking AI answers and code with competing AI assistants.
The working version sends an email when:
- a category goes over budget this month
- cash flow for the month turns negative
- new transactions need a category
- a new expense of $500 or more arrives, skipping expected bills you list, like rent
A time-driven trigger runs the check once a day.
When I tested the script against my spreadsheet, the test run found 8 categories over budget, led by Vacation at $253.98, and 3 transactions to categorize.
4. Claude and ChatGPT can read your Canvas sheet too
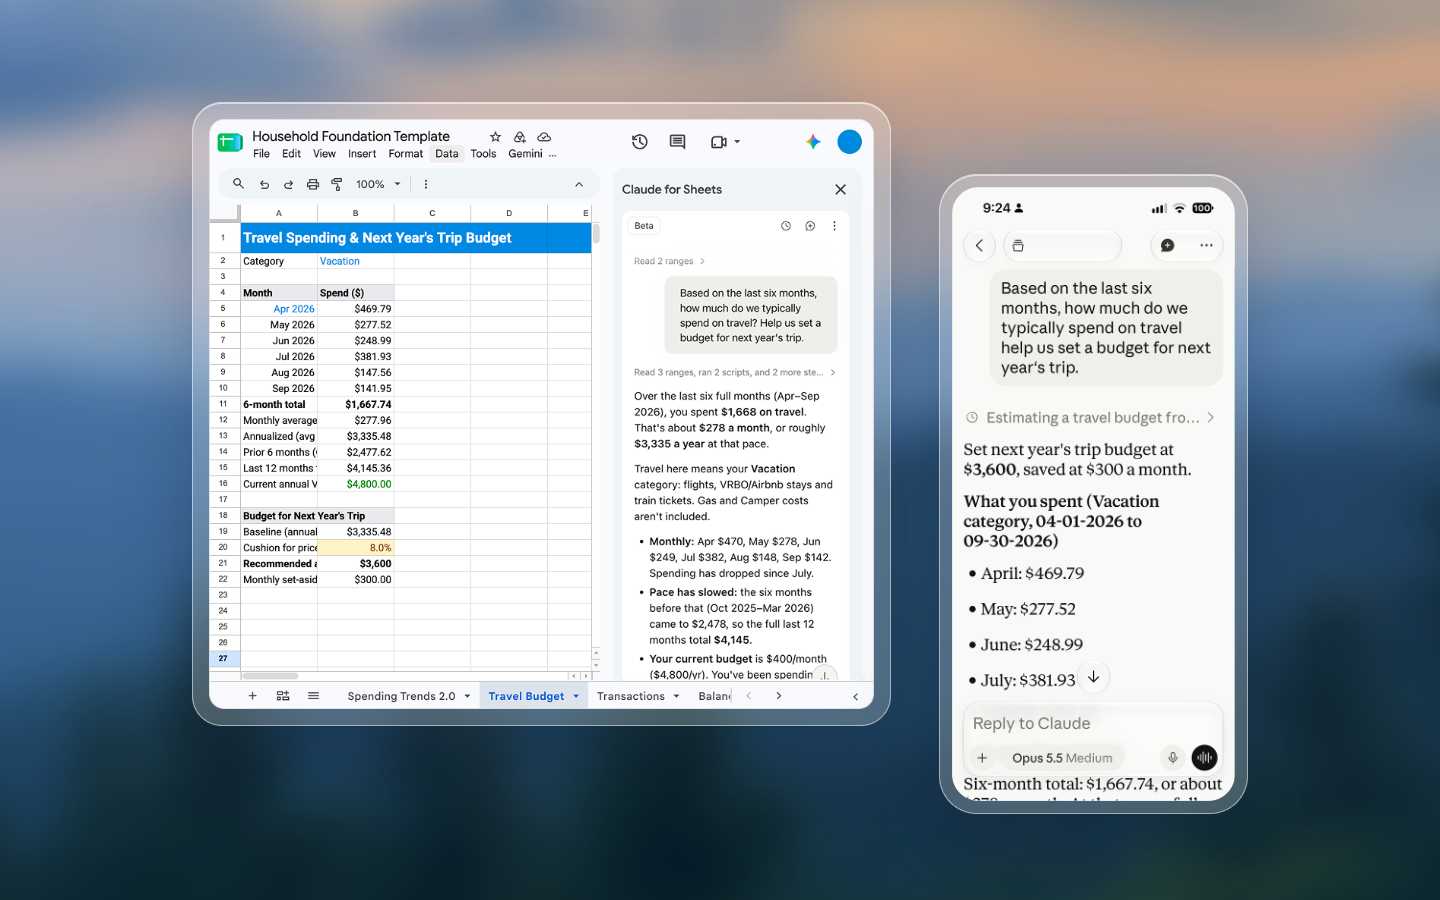
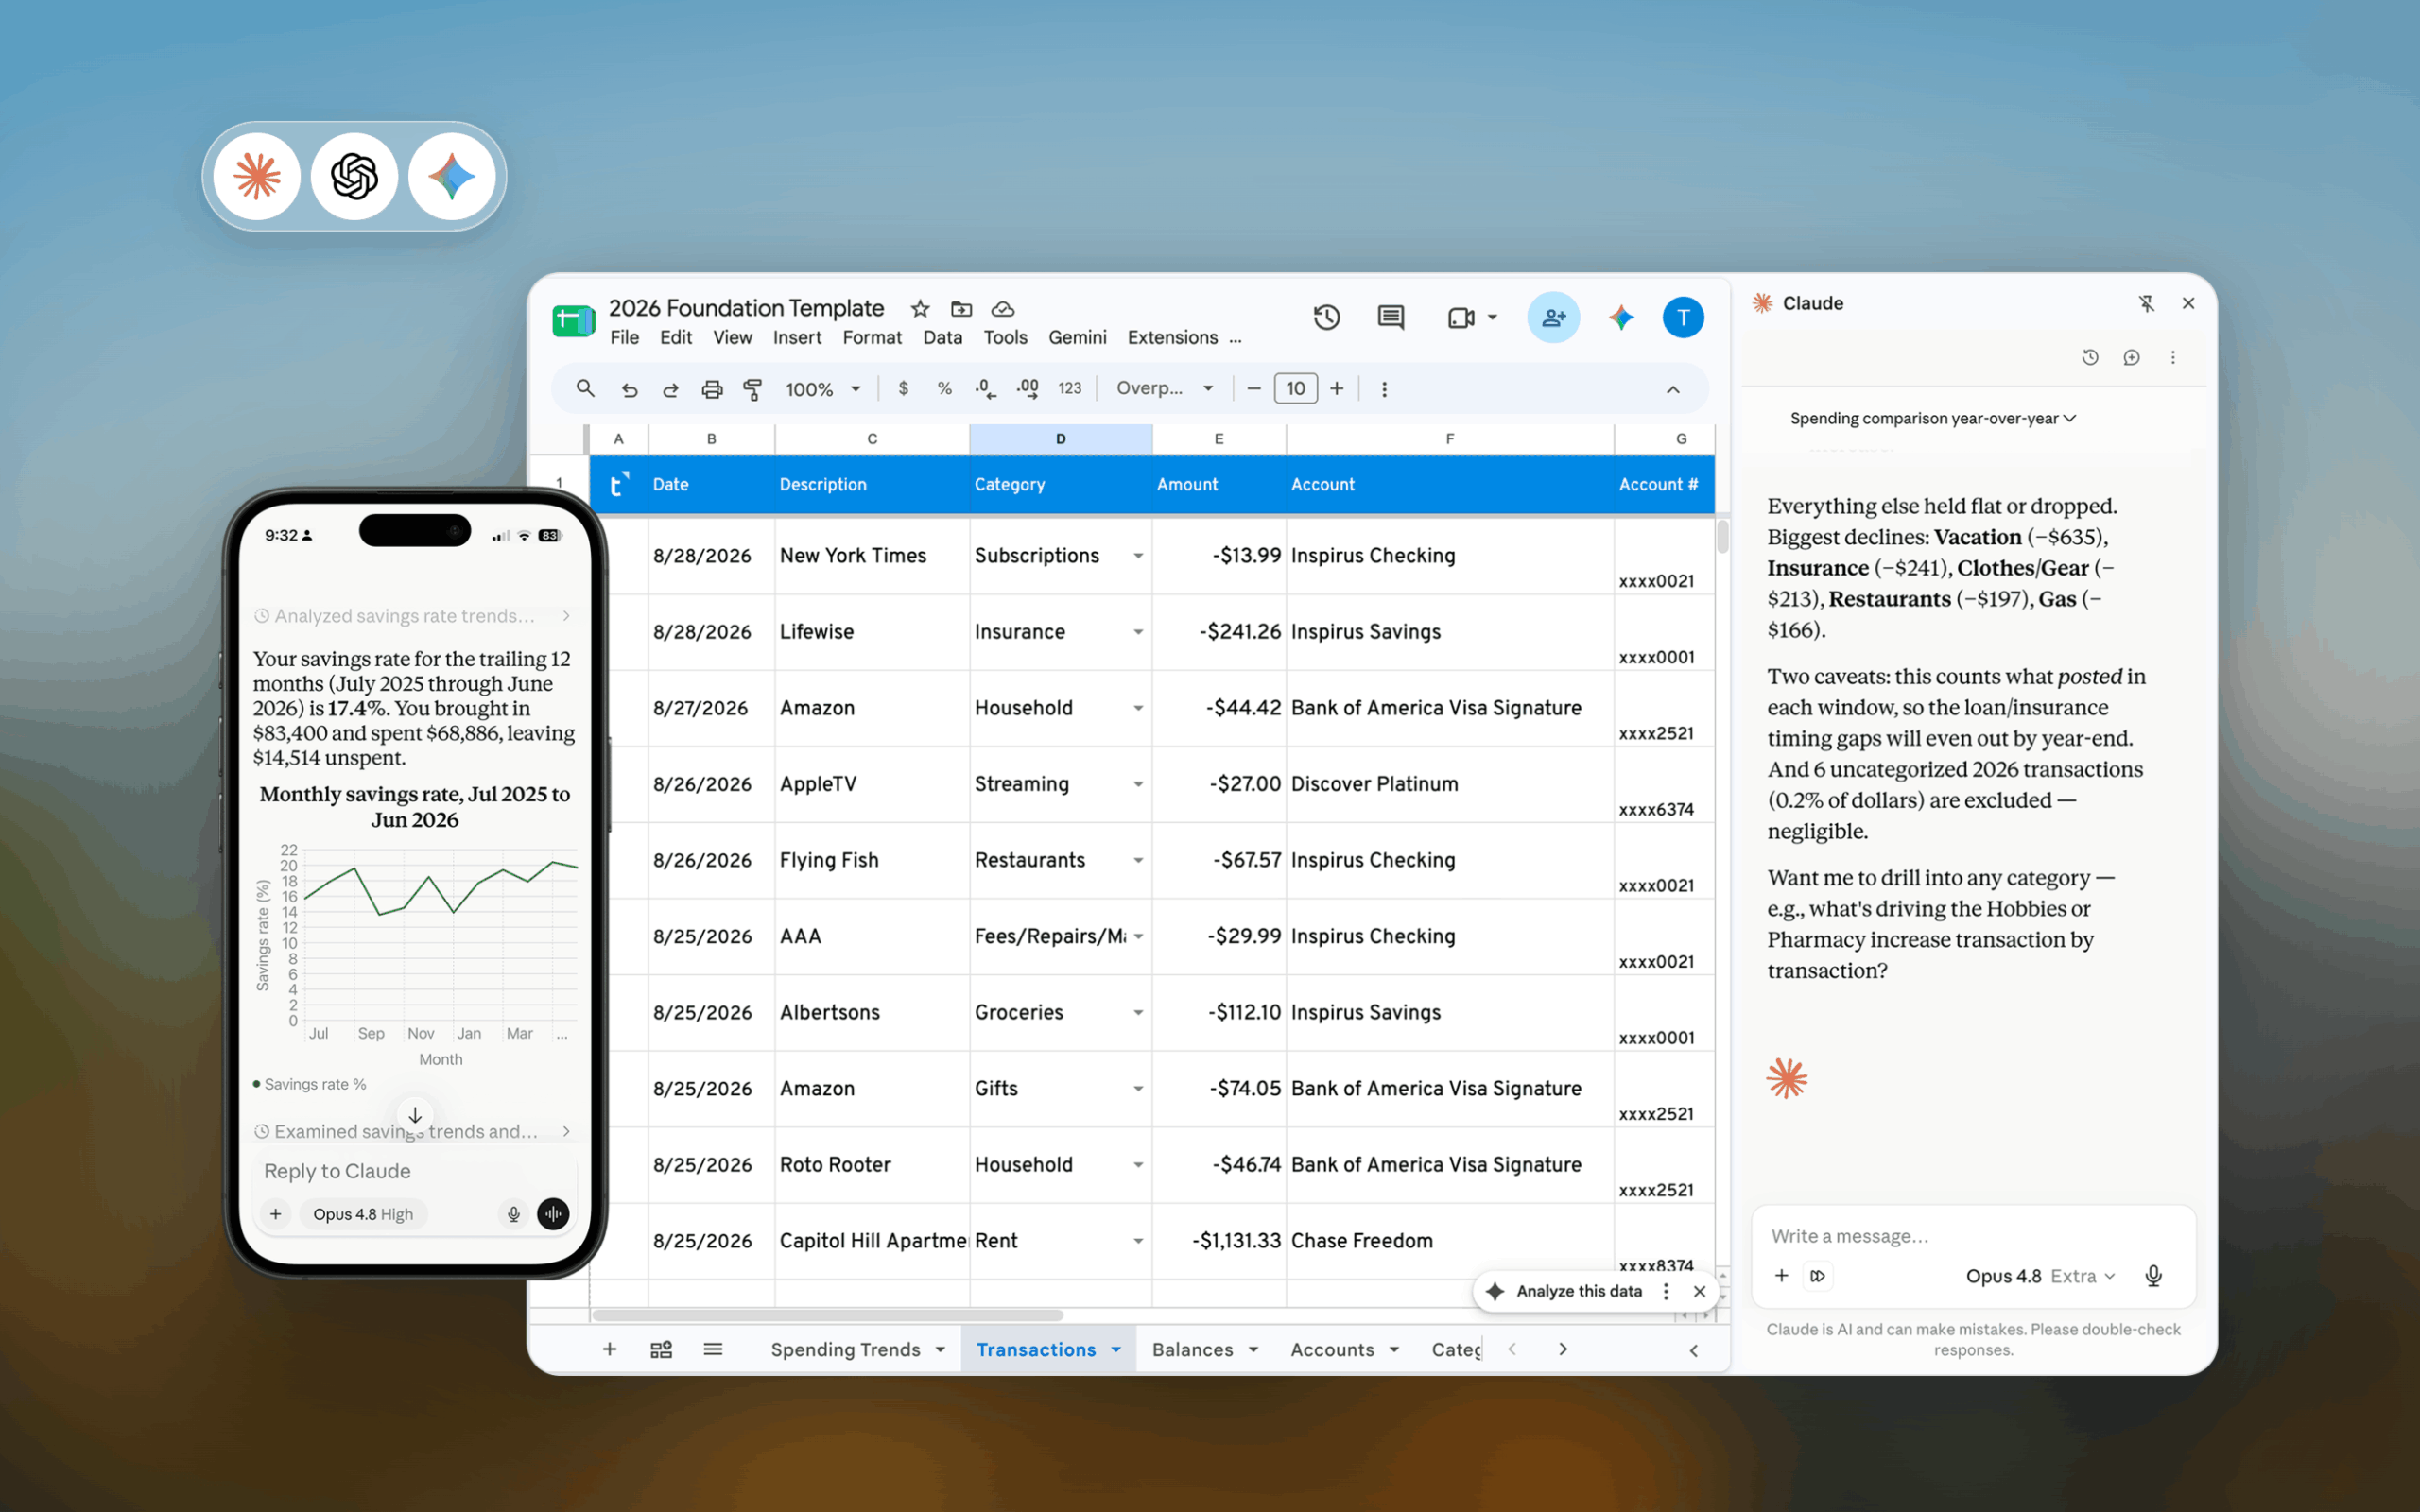
I asked Gemini whether other AI tools could read the dashboard. Gemini said yes, and pointed out that AI assistants answer from the same sheets the canvas uses, so their numbers match the dashboard.
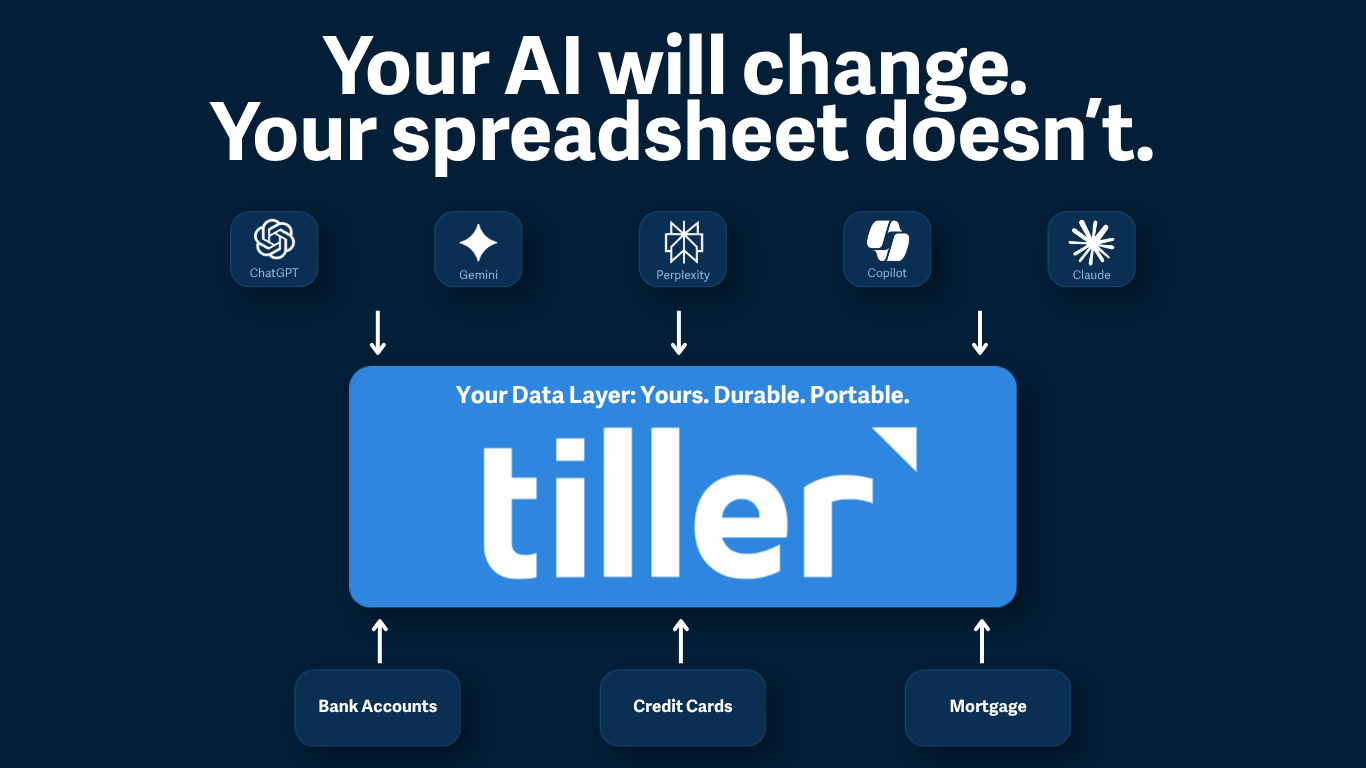
Any AI that can read a spreadsheet can read your Tiller data.
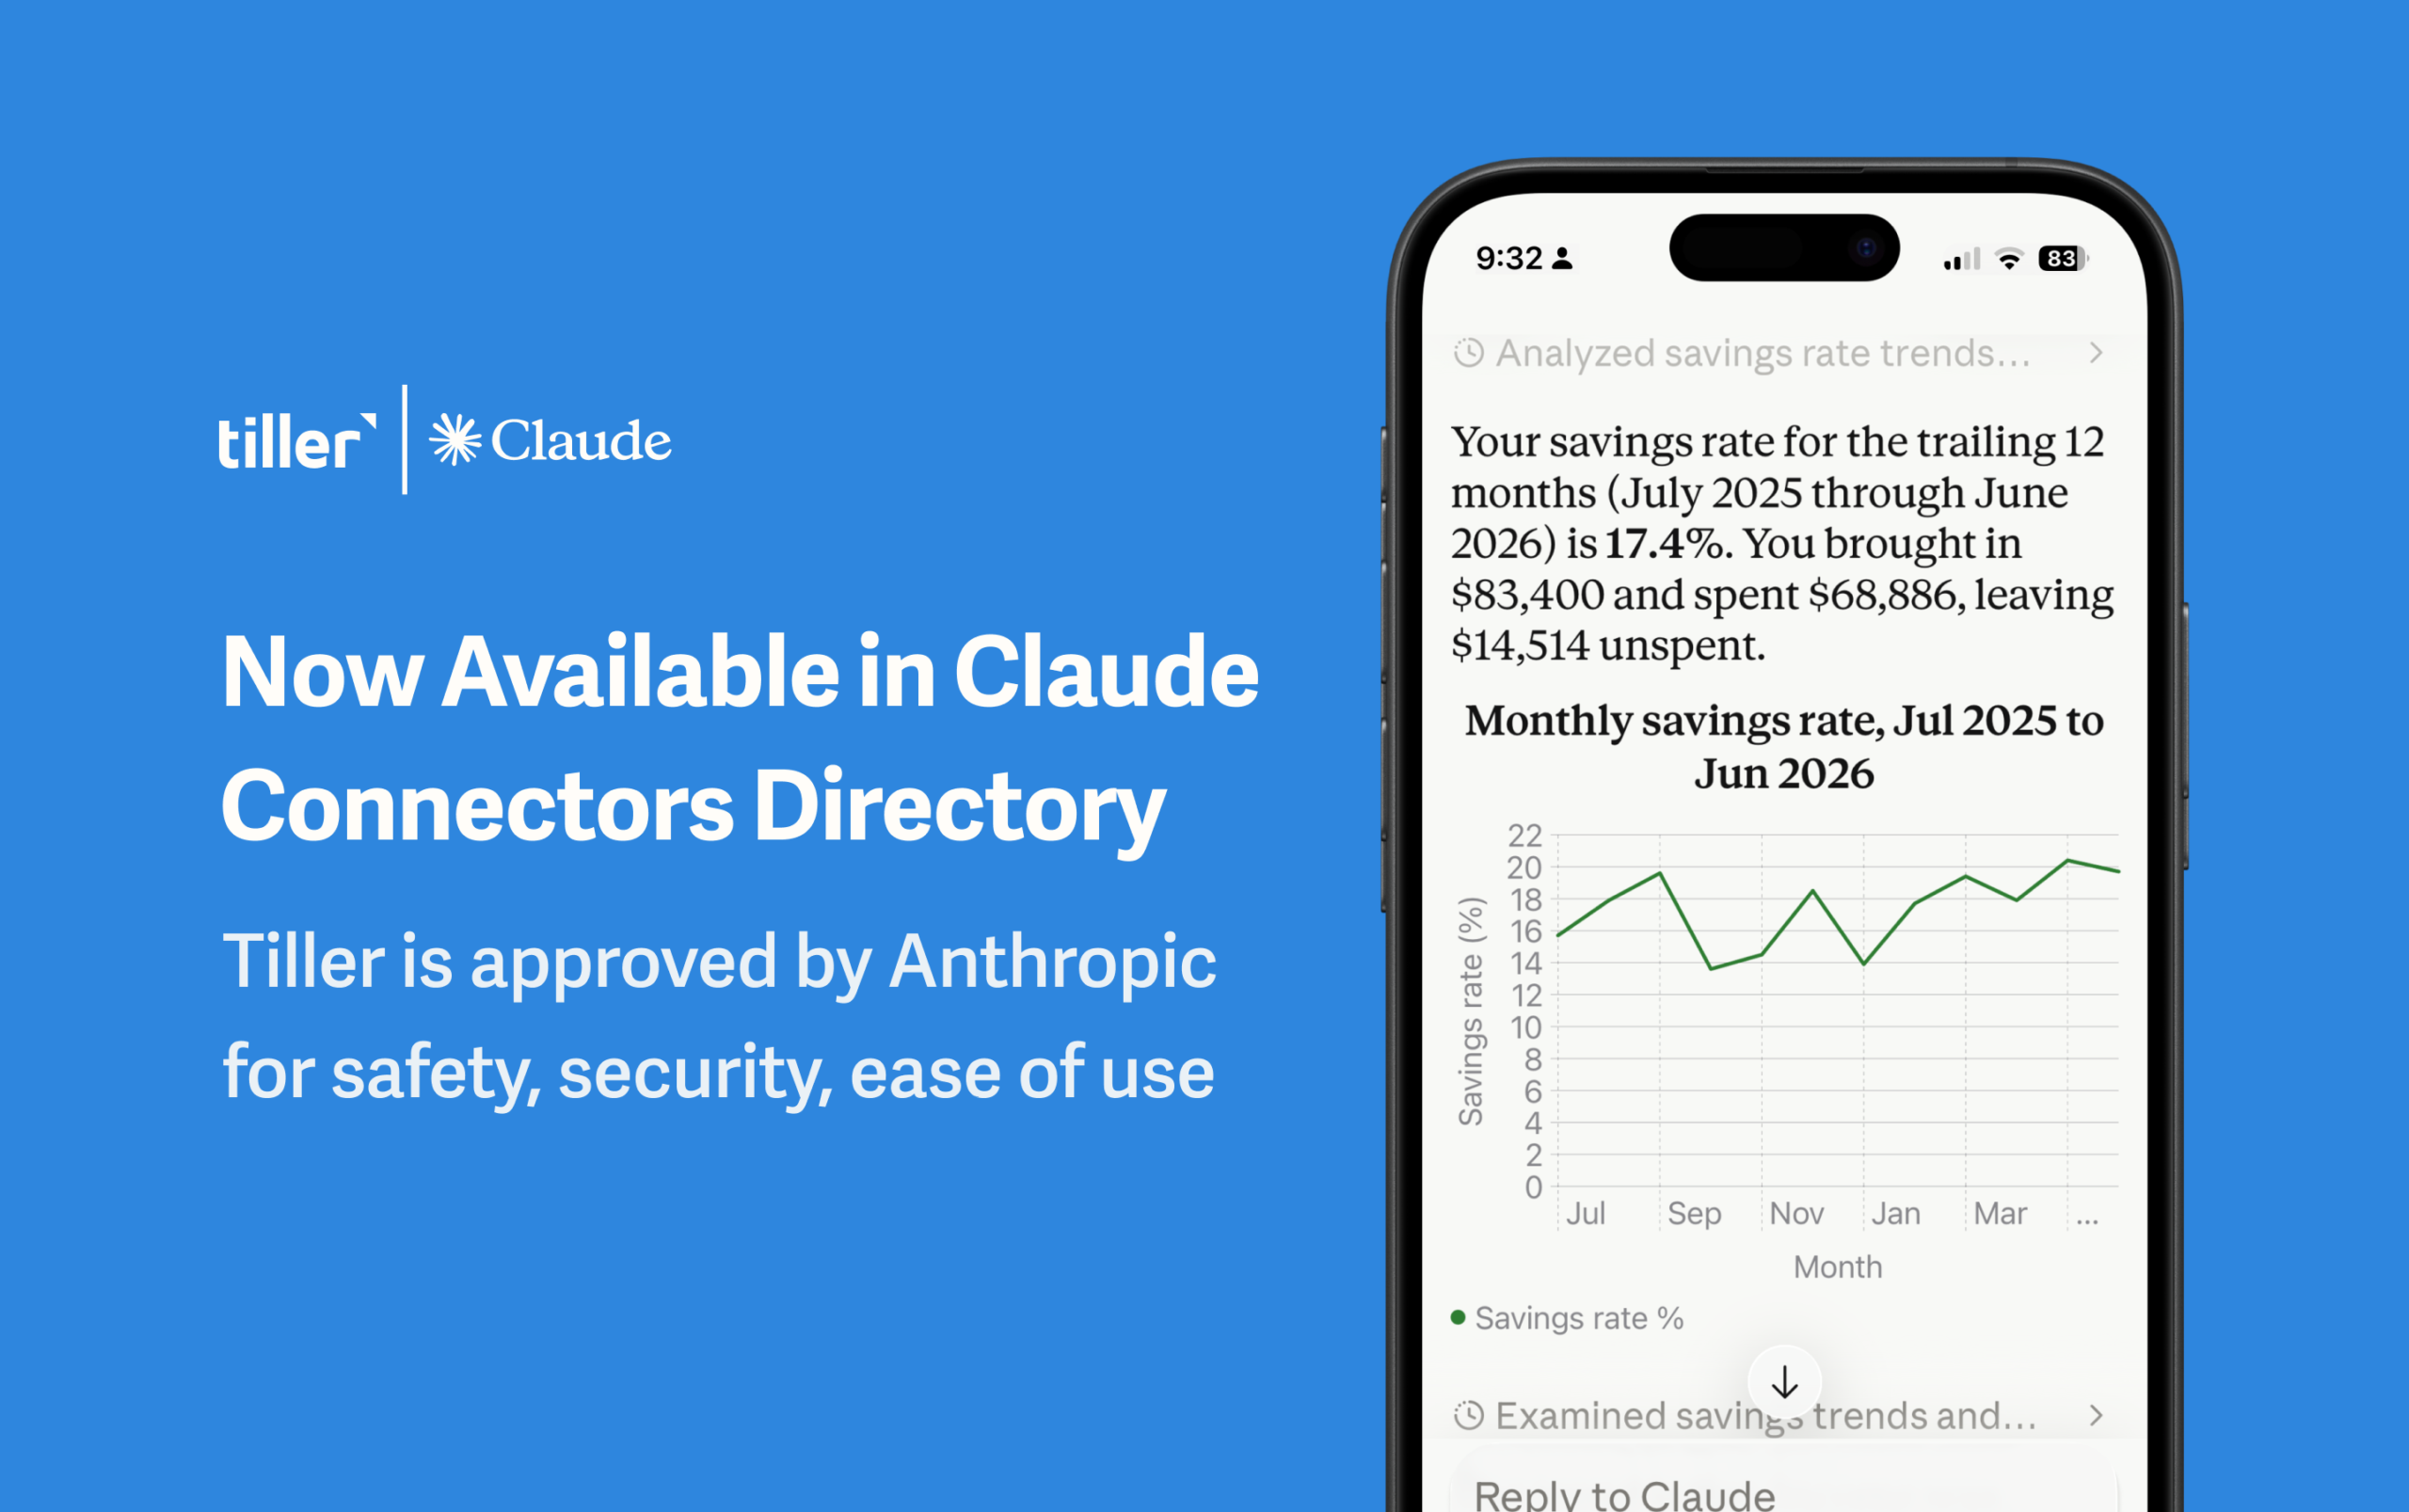
See: With Tiller MCP for Claude, Claude reads your Transactions, Balance History, and Categories sheets directly.
5. Take the dashboard to your phone
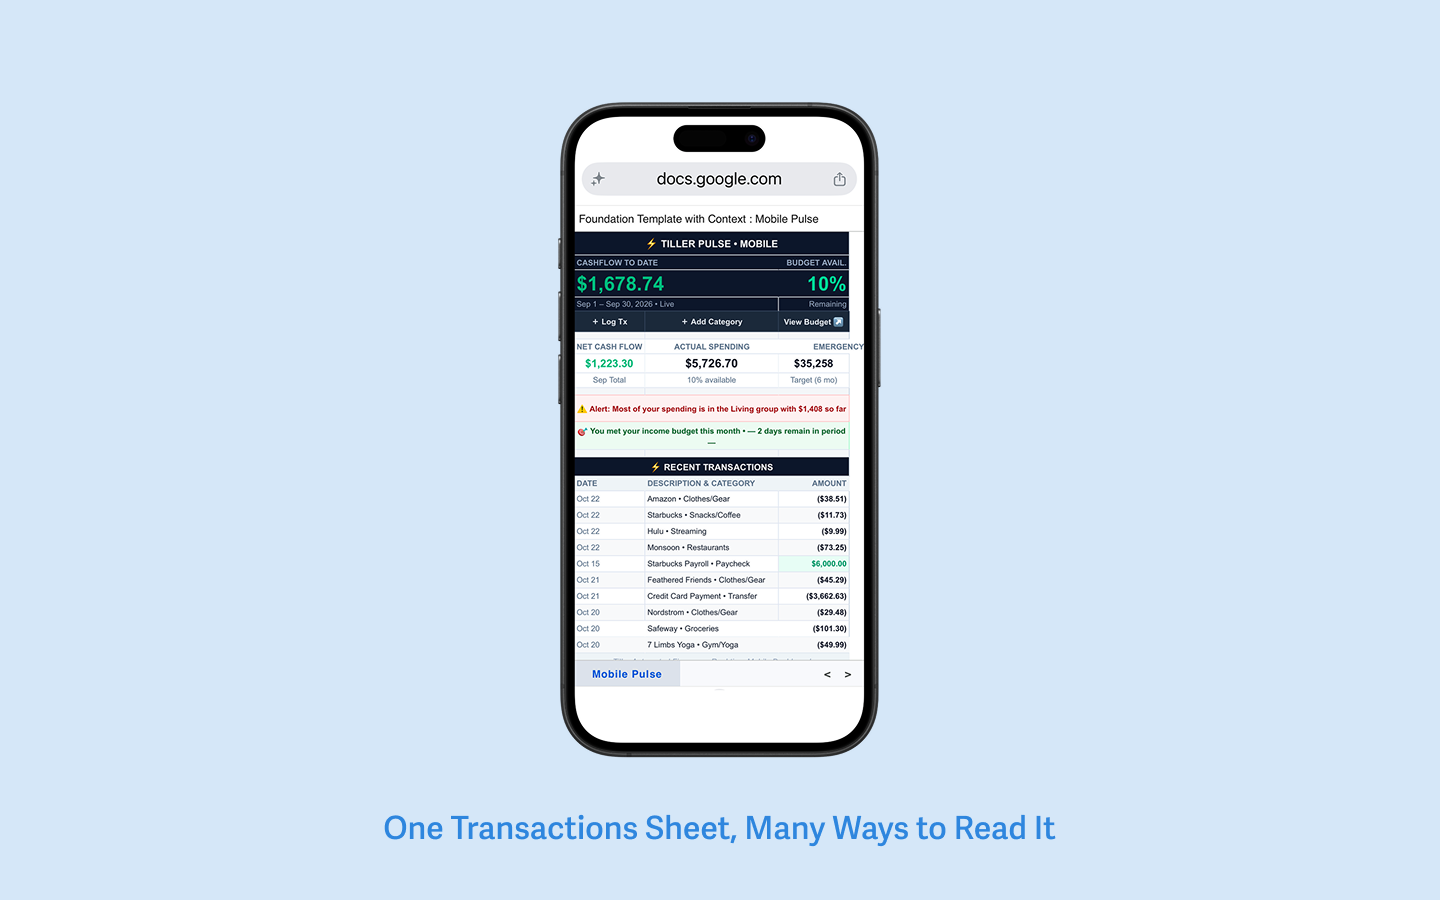
I also wanted a clean mobile view of the dashboard. Unfortunately, Canvas tabs aren’t supported in embedded sites, and they’re not viewable in the Google Sheets mobile app.
So I asked Gemini for a regular tab sized for a phone screen.
Gemini built Mobile Pulse as the first tab, three columns wide, with cash flow, spending, the emergency fund target, budget alerts, and the 10 latest transactions.
This was clunky on the first pass, but after a bit of back and forth, Mobile Pulse fit the phone screen and somewhat matched the dashboard’s design.
Try Canvas on your own spreadsheet
If you have a compatible plan and use Google Sheets, we highly recommend giving it a try. You can always delete any sheets created in your experiment and roll back any changes.
And as always, share what you’re building with AI in the Tiller Community.