
Mint has been gone for nearly three years, yet many users still miss some of its features.
Just this week, a post on r/mintuit asked, “Is there anyone else who still misses this chart?”
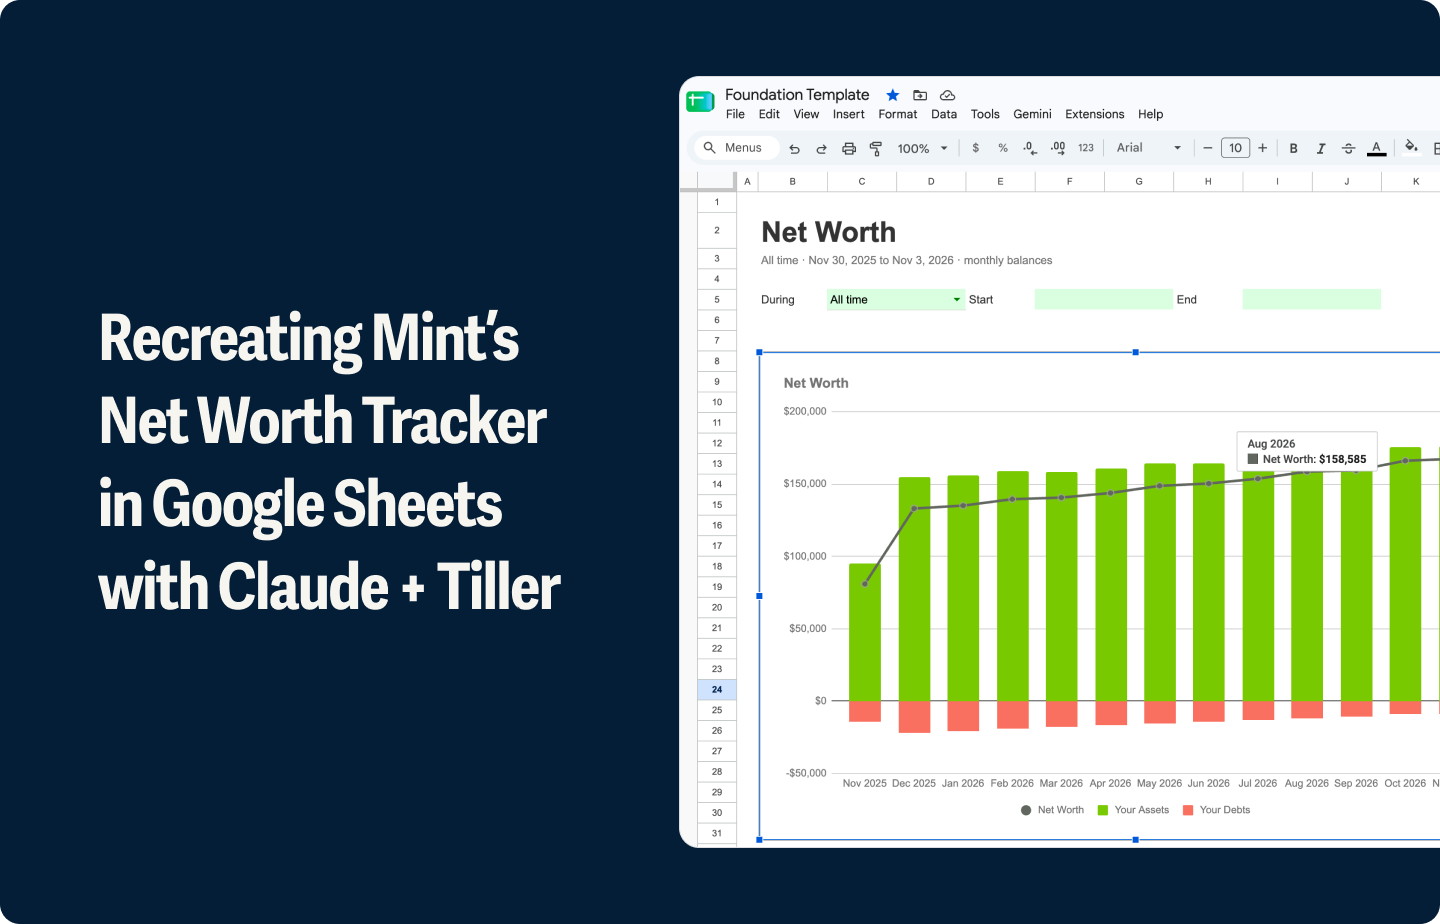
The chart in question is Mint’s net worth tracker. It used green bars to show assets above zero, red bars for debts below zero, and a line to track net worth across every month of your financial history.
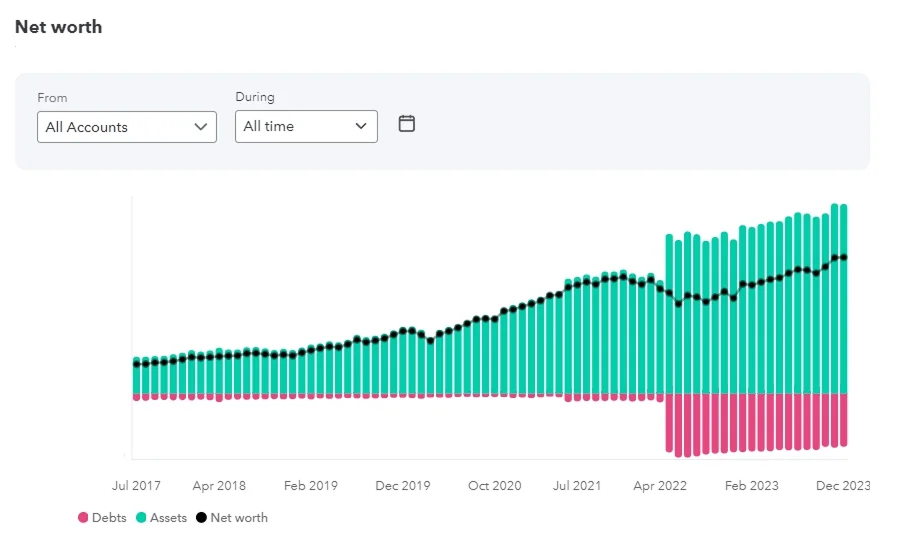
As the poster recalled, nothing beat “seeing those bars rise up a little more each month.”
But when Intuit shut down Mint, the chart disappeared with the app (and for many, years of financial data.)
This is yet another reason to keep your financial source of truth in a spreadsheet you own. Owning your spreadsheet also means you can customize the charts and reports that visualize your data and answer your money questions.
Today with AI, customizing a spreadsheet is easier than ever.
With AI in Google Sheets or Microsoft Excel, you can describe the chart you want in plain English, and the AI will write the formulas. Your initial question shifts from “How do I build this?” to “What do I want to know?”
(Reminder: AI is 100% optional with Tiller, and you choose your AI models and workflows.)
Inspired by the Reddit post, I decided to see if I could rebuilt Mint’s chart in my own Tiller spreadsheet.
Working with Claude, the first working version took about 10 minutes. My spreadsheet uses the Foundation Template, which already tracks balances across all my accounts, so the chart had all the necessary data. I had Claude research Mint’s net worth charts, found some old screenshots, and finally approved a plan for Claude.
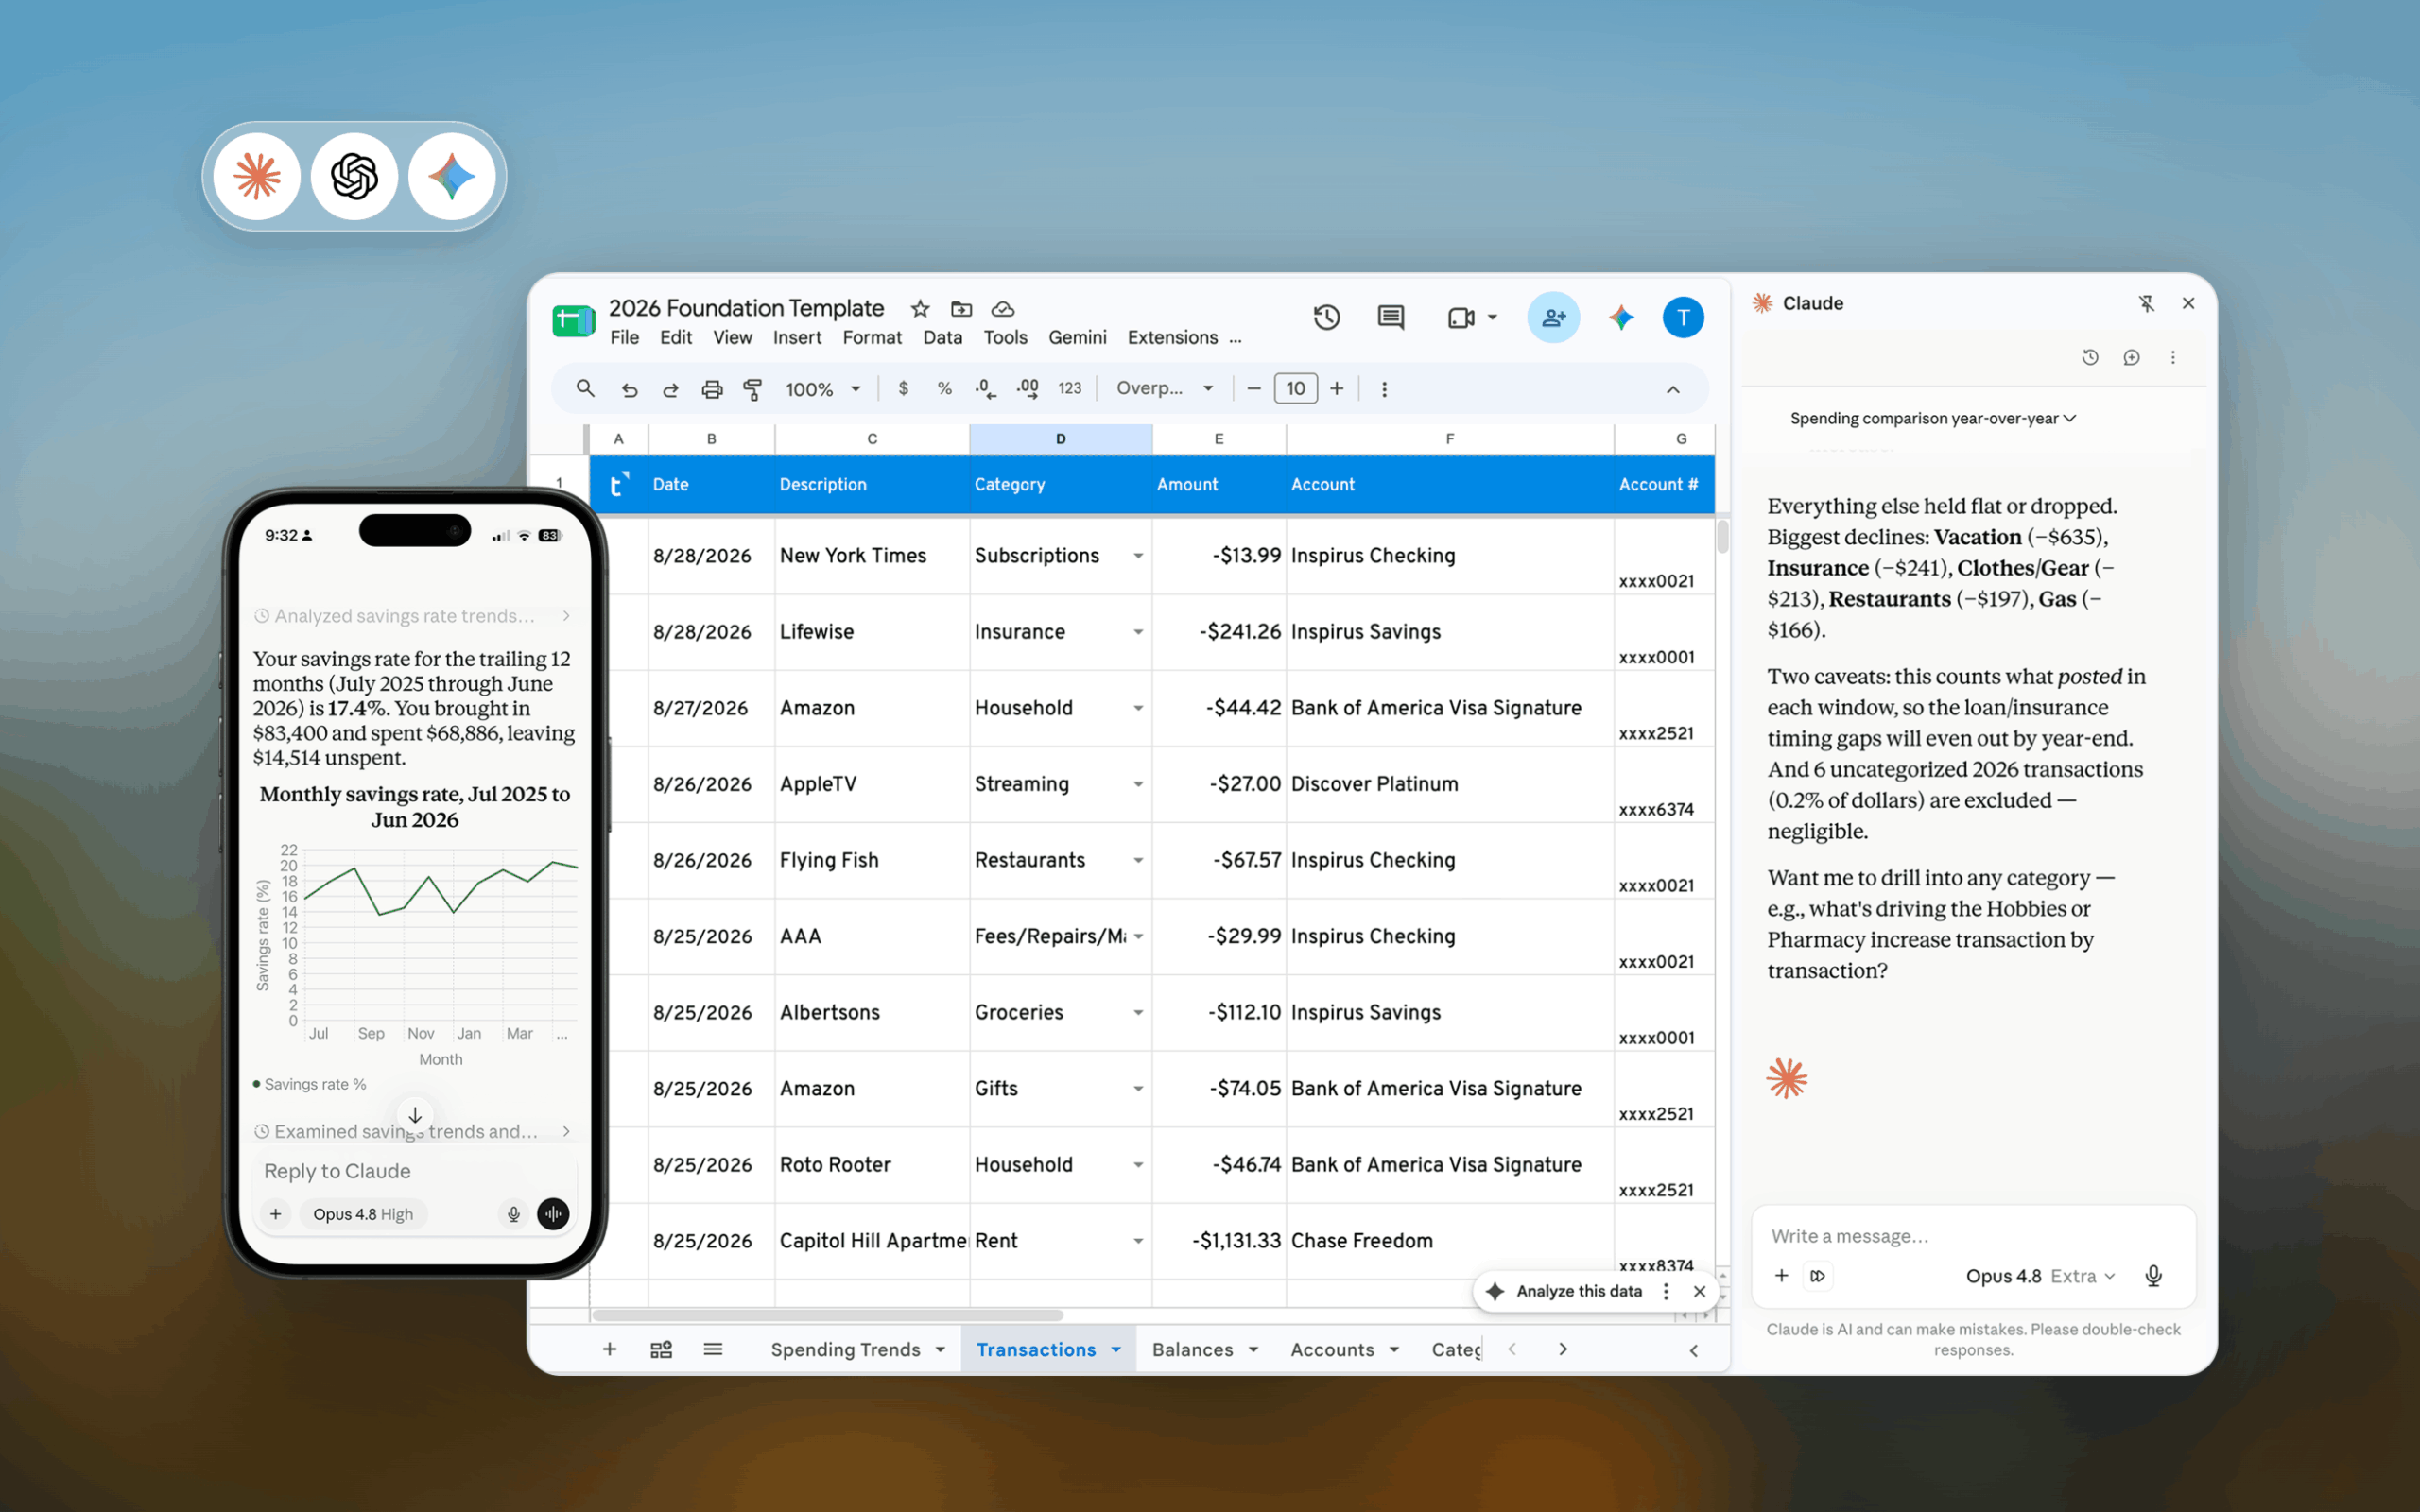
Claude (and later, ChatGPT) wrote the formulas, built the chart and its dropdowns, and matched the totals to my Balance History.
You can copy my sheet into your own Tiller spreadsheet in three steps, or provide the prompt below to Claude, ChatGPT, or Gemini to build your own.
Mint’s Chart Had Two Dropdowns: “During” and “From” — And So Does This One
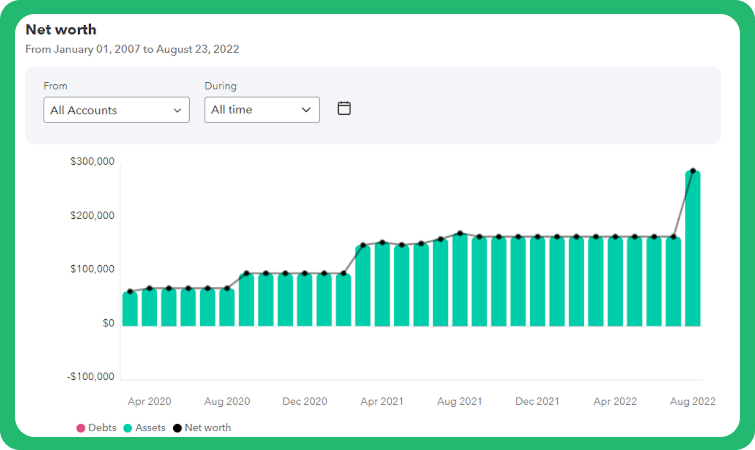
With Mint gone, I rebuilt the chart using Mint screenshots and former users’ Reddit posts. The 2022 version featured two dropdowns above the chart.
“During” set the time period. Former users recall five options: year to date, past 6 months, past 12 months, all time, and a custom range.
“From” determined which accounts the chart included. Former users describe picking several accounts to chart together, such as all student loans but no other debt.
A subtitle under the main title specified the date range, and the last bar covered the current month up to today.
See Every Month of Your Assets, Debts, and Net Worth in One Chart
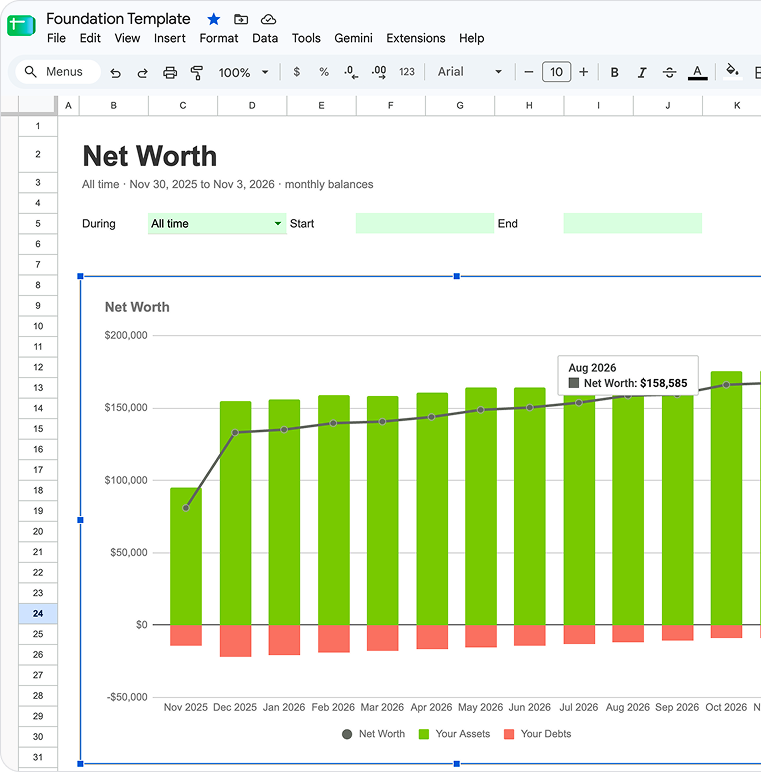
Mint Net Worth transforms the balances on your Balance History sheet into the same monthly chart, using Mint’s labels: Net Worth, Your Assets, and Your Debts.
Hover over a bar or dot to view that month’s specific number. The “During” function works like Mint’s, and a custom range of 62 days or less automatically switches the chart to daily balances.
“From” allows you to include all your accounts, only specific accounts you select, or every account except your chosen exclusions. Each of the 12 picker cells can take a single account or an entire group, such as “Group: Investments.” For example, by picking only your credit cards, you can track how quickly you’re paying them down.
You’ll know if the latest month is incomplete because a status line next to “From” flags any account that hasn’t updated in over a week.
Expand the rows below the chart to see each month’s totals and account count, plus a review that flags possible duplicate accounts and negative debt balances.
Debts are counted as your bank reports them, so an overpaid credit card will count in your favor. Accounts you mark “Hide” on the Accounts sheet will stay off the chart, just as they do on the Balances sheet. To include them, uncheck “Respect Accounts Hide” on the Mint Net Worth sheet.
Add Mint Net Worth to Your Spreadsheet in Three Steps
Mint Net Worth works in any Foundation Template spreadsheet in Google Sheets, even if you’ve moved or added columns.
- Open the linked Google Sheet in template view
- Right-click the “Mint Net Worth” tab, choose “Copy to,” then “Existing spreadsheet,” and select your Tiller spreadsheet.
- Note I’ve also included the ChatGPT version
- In your spreadsheet, rename “Copy of Mint Net Worth” to “Mint Net Worth” to ensure the account dropdowns continue to function correctly.
The chart automatically populates with balances from your Balance History sheet. Hover over the “From” dropdown for a note on each option.
Build Your Own Version with ChatGPT or Claude
To build the chart yourself or customize its functionality, provide this prompt to an AI capable of editing your Google Sheets spreadsheet.
The prompt describes how Tiller populates your spreadsheet, ensuring the chart continues to function as new balances arrive daily.
I use Tiller with the Foundation Template in Google Sheets. Build a new sheet named Mint Net Worth that recreates Mint's all-time net worth chart. Read my spreadsheet first, then follow the rules below. If my spreadsheet and these rules disagree, follow my spreadsheet and tell me about the mismatch. Show me your plan and wait for my yes before you change anything.

How my spreadsheet works
- Each time my accounts refresh, Tiller adds a balance for each linked account to the Balance History sheet. The sheet is hidden by default. Its headers include Date, Time, Account, Account #, Institution, Account Id, Balance, Type, and Class.
- New balances can land anywhere on Balance History, so find them by the Date column and read whole columns, not fixed ranges.
- Balance History stores debts as amounts owed, usually positive numbers. Subtract each Liability balance as recorded, so an overpaid credit card counts in my favor. Flag any debt account with negative balances so I can review the sign, and let me flip the sign for one account.
- The Accounts sheet holds my settings in the Account, Class Override, Group, and Hide columns. Starting at the Unique Account Identifier column, Tiller lists every account with its Account Id, latest balance, Class, Group, and Hide.
- The Account, Group, and Hide headers appear twice on Accounts, so read the account list's copy of each header, starting at Unique Account Identifier. The Class column in that list already applies my Class Override.
- Leave out any account marked Hide, and add a checkbox on the new sheet to include those accounts.
- Match balances to accounts by Account Id, not by name. A renamed account keeps its old name on older balances. Flag accounts that look like duplicates, such as the same name or account number at the same bank.
- Never edit Balance History, Accounts, Transactions, Categories, AutoCat, or the hidden Tiller sheets.

What to build
- A combo chart with one bar per month: total assets as green bars above zero, total debts as red bars below zero, and net worth as a gray line with a dot for each month. Label the series Your Assets, Your Debts, and Net Worth, as Mint did.
- For each month, use each account's newest balance on or before the month's last day, by Date and then Time. The current month uses the newest balances so far.
- Carry each balance forward through months with no new balance. If an account hasn't had a new balance in 45 days, stop counting the account after the month of its last balance, so closed accounts drop off.
- Start the chart at the first month with balance data. For a custom range of 62 days or less, plot daily balances.
- A During dropdown with All time, Year to date, Past 6 months, Past 12 months, and Custom, plus start and end date cells for Custom.
- A From dropdown with All accounts, Only selected, and Exclude selected, plus 12 dropdown cells where I can pick single accounts or whole groups, like "Group: Credit Cards."
- A subtitle under the title with the period and its dates.
- A status line beside From, like "9 of 9 accounts included." Add "1 hasn't updated in over a week" when a selected account's newest balance is more than 7 days old.
- A table of each month's assets, debts, net worth, and account count, plus an account review that lists possible duplicates, negative debt balances, and accounts that haven't updated in over a week.

Rules for the build
- Find every column by its header name, never by its column letter, so the sheet works in anyone's copy. Ignore capitalization when you match a header.
- Use formulas, not scripts.
- Color the cells I edit #E4FFE4, the green the Foundation Template uses for its inputs.
- Show a short message instead of an error when a sheet or header is missing.
- Keep the chart and controls at the top. Put the monthly table, account review, and helper columns in a row group under the chart, and collapse the group.

When you're done
- Check one month by hand: add up that month's balances on Balance History and compare the totals with the monthly table.
- Tell me which accounts the chart includes, and name any account whose newest balance is more than a week old.
Your Chart Starts with Your First Tiller Balance
Mint Net Worth can only chart the balances available on your Balance History sheet, so the first bar will represent the month Tiller added your initial balance.
If you linked accounts in different months, the chart will show a jump each month a new account first appears. You can manually add older balances to Balance History to fill in earlier months.
Three details operate differently from Mint:
- Mint’s hover box displayed the month’s net worth, balance date, and account count together. Google Sheets shows one value at a time.
- Mint’s “From” dropdown was a single checklist. Mint Net Worth uses separate picker cells, ensuring your selections remain even when you link a new account.
- An account that goes 45 days without a new balance will drop off after its last recorded month, preventing a closed credit card from continuously adding its old balance to subsequent months.
If your spreadsheet doesn’t use the Foundation Template, ask the AI to adapt the prompt to your sheet names and headers first.
You can build other views the same way. Show the AI an existing report and ask for different logic, or describe a monthly review and ask for the script that runs the review. You could build a tracker for one spending category, a cash flow dashboard, a weekly budget email, or a money app for your phone.
Your financial source of truth. Yours to keep and build on.
Tiller adds your daily transactions and balances to a spreadsheet you own. We’ve spent more than a decade building the feeds, spreadsheet structure, and tools that help people keep their finances organized. AI gives customers more ways to use that system.
Try Tiller free for 30 days
Start a 30-day free trial of Tiller, link your accounts, and add Mint Net Worth to your Foundation Template in Google Sheets.
If you cancel, your spreadsheet and your balance history remain yours, even if you stop using Tiller.