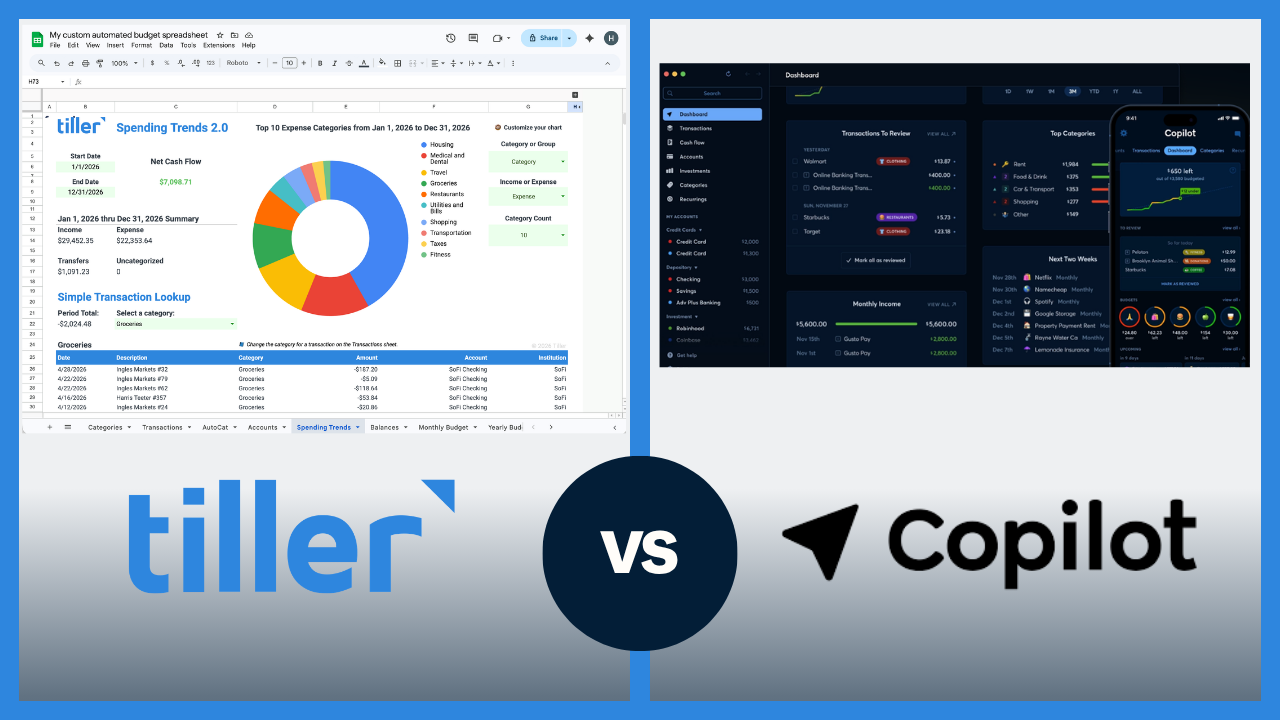

A financial dashboard is a single sheet that answers the most important questions about your money at a glance. A dashboard is even better when all of your transactions are automatically added to your spreadsheet and categorized correctly. Your dashboard automatically updates itself with accurate, up-to-date data.
This guide covers how to build that kind of dashboard. It shows you what to include, how to structure it, the formulas that connect it to your transaction data, and how Tiller’s automated feed keeps it up to date without any manual work.
What a financial dashboard should do
A dashboard’s job is to give you a clear, up-to-date picture of your finances in the shortest time possible. Every element on it should answer a real question you have about your money so that you can take appropriate action.
The most useful dashboard questions for most people include:
- How much have I spent this month? Your total spending to date vs. your monthly budget.
- Where am I over budget? Categories that have exceeded their monthly limit.
- What’s my current cash position? Your total account balances for checking and savings.
- What’s my net worth? Total assets minus total liabilities.
- How does this month compare to last month? Month-over-month spending trends.
- What’s my savings rate? Income minus expenses as a percentage of income.
The right dashboard for you should show the numbers you need to make decisions. To test what those numbers are, ask what would happen if you removed a number from your dashboard. Would it change how you manage your money? If it doesn’t, you should remove it from your dashboard.
The two-layer dashboard structure
Effective financial dashboards have two layers.
Layer 1 — Summary numbers (top of dashboard)
Three to six key metrics are displayed prominently. These are the numbers you check every time you open your spreadsheet for a quick overview of your financial situation. Keep this section to one screen, no scrolling required.
Example layout:
- Monthly spending to date: $2,847 / $3,500 budget
- Net worth: $67,420 (↑ $1,240 from last month)
- Savings rate this month: 18%
- Largest category over budget: Dining Out ($127 over)
Layer 2 — Charts and breakdowns (below the summary)
Visual representations of the same data let you see patterns rather than just numbers. These are the things to look at for context when you want to understand a trend or investigate a number in the summary. You may check these only periodically.
Common charts:
- Monthly spending by category (bar or pie chart from your budget sheet)
- Net worth over time (line chart from your monthly snapshots)
- Month-over-month spending comparison (grouped bar chart by category)
How to connect your dashboard to live transaction data
The dashboard itself contains no raw data. It only displays data from other sheets. When transactions arrive in your Transactions sheet, are categorized, and your budget formulas recalculate, the dashboard numbers update automatically.
There are three ways to connect your sheets:
Direct cell references. This is the simplest approach. If your total monthly spending is calculated in cell B47 of your Budget sheet, your dashboard can display it with =‘Budget’!B47. The dashboard cell always reflects whatever is in that budget cell.
SUMIFS formulas. These formulas help you pull specific data directly into the dashboard. If you want to show spending in a specific category, use a SUMIFS formula with the category name, date column, and amount column as criteria. This pulls directly from your transaction data, so it is updated automatically as new transactions arrive.
Named ranges. This is needed only for dashboards that need to reference the same data points in multiple places. Name a range in your Budget sheet (e.g., TotalSpent) and reference it anywhere in your workbook. Named ranges make formulas readable and easier to update.
Building charts that update automatically
Charts in Google Sheets and Excel update automatically when the data they reference changes. This means a chart that uses your budget data will reflect new transactions every time AutoCat runs, or you manually categorize a transaction.
Two charts are especially helpful to include in your dashboard:
Spending by category — bar chart:
- Create a two-column table on your dashboard: Category names in column A, spending totals in column B (using SUMIFS formulas for each category).
- Select the table and insert a bar chart.
- The chart updates automatically as the underlying SUMIFS recalculate.
Net worth over time — line chart:
- Maintain a monthly snapshot table: one row per month, columns for Total Assets, Total Liabilities, Net Worth.
- Select the table and insert a line chart.
- Add a new row each month — the chart extends automatically.
Keep charts simple, label as much as you can, and limit each chart to one or maybe two data points.
How Tiller keeps your dashboard current
Tiller downloads your transactions every day, AutoCat categorizes the ones that match your rules, your SUMIFS recalculate, your budget updates, and the new data flows automatically into your dashboard. This happens every day without any action from you.
The result is that whenever you open your spreadsheet, your dashboard already reflects what’s happened since you last opened it. You don’t have to update anything. You can just review the numbers.
If you don’t want to create your own dashboard, Tiller’s Foundation Template includes a pre-built dashboard with spending by category, account balances, and budget vs. actual automatically connected to your transaction data from day one. It’s fully customizable, so you can add, remove, or rearrange elements to match the questions you actually want to answer.
Frequently asked questions
What is transaction categorization and why does it matter?
Transaction categorization is the process of labeling each bank transaction with a spending category, such as Groceries, Dining Out, Subscriptions, Housing, and so on. Categories make a transaction log useful by connecting individual transactions to your budget, enabling spending-by-category reports, and making SUMIF formulas work. Without consistent categories, you aren’t able to get meaningful insight into your finances.
How does automatic transaction categorization work in a spreadsheet?
Rule-based categorization uses if/then logic to assign categories automatically. You define rules — for example, “If the description contains Whole Foods, assign Groceries” — and the system applies them to every matching transaction. Rules can match on description text, transaction amount, account source, or combinations of conditions. Once the rules are set, matching transactions are automatically categorized without any manual work.
How long does it take to set up categorization rules?
Initial rule setup takes most people 30–60 minutes. You identify your most frequent merchants, build rules for the top 20–30, and test them against recent transactions. After that, you’ll add occasional rules for new merchants. Tiller’s AutoCat Rule Builder speeds up initial setup by letting you create rules directly from recent transactions.
What percentage of transactions can I expect to categorize automatically?
For most users with an established rule set, 80–90% of incoming transactions are automatically categorized. The remaining 10–20% are typically new merchants, one-off purchases, or transactions with ambiguous descriptions. This percentage improves over time as your rule set grows to cover more of your regular spending patterns.
How do I handle merchants like Amazon that sell multiple types of products?
Amazon is the most common multi-category challenge. The most practical approaches are to create amount-range rules to split Amazon transactions by likely category (small purchases to Shopping, large purchases to a review queue), create a dedicated Amazon or Mixed category for all Amazon purchases and review them during your weekly check-in, or use an exclusion rule to flag Amazon transactions for manual categorization while automating everything else.
Does AutoCat work on past transactions or only new ones?
By default, AutoCat runs on any uncategorized transactions — both past and new — when you manually trigger it. There’s also a “Run Rules on All” option that applies your rules to all transactions in your sheet, including those already categorized. Use the Run Rules on All option carefully, as it will overwrite existing categories where a rule matches.
Can I use AutoCat if I’m not connected to Tiller?
AutoCat is a Tiller feature and requires a Tiller subscription. However, the rule-based categorization concept works in any spreadsheet. You can build your own logic using Google Sheets’ or Excel’s IF formulas or conditional formatting to apply categories based on description text, though this requires more manual spreadsheet setup than AutoCat provides.
Can I split a transaction across multiple categories in my spreadsheet?
Yes. Tiller’s Transaction Splitter tool lets you divide a single transaction into multiple rows, each with its own amount and category. This is particularly useful for transactions from merchants like Costco, Target, or Amazon, where a single charge covers multiple spending types. For transactions you split regularly, like paycheck deductions or shared bills, the Saved Splits feature lets you save a split template and reuse it with one click.