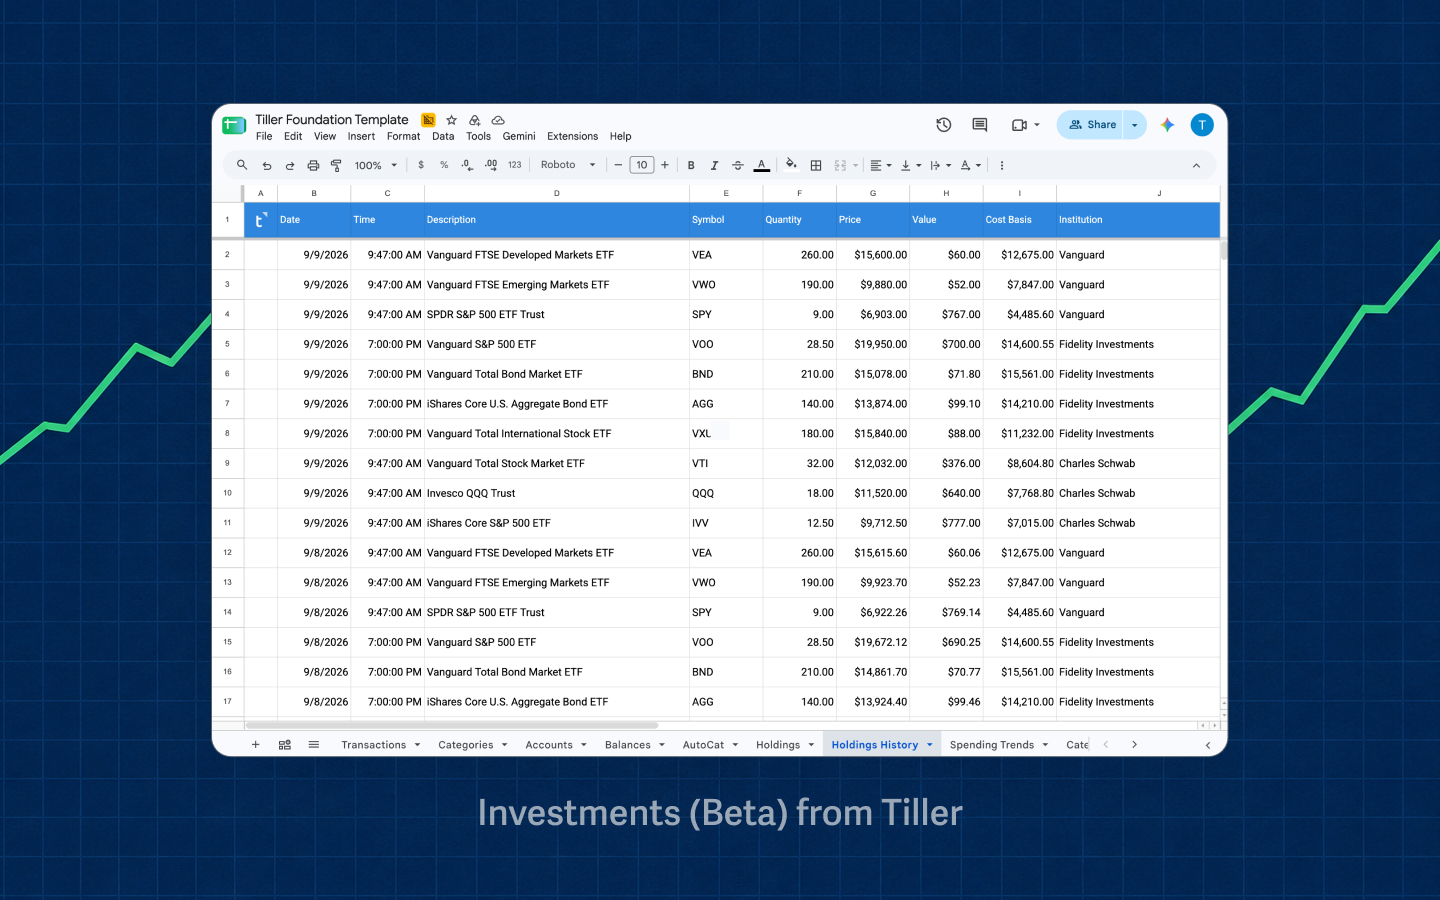
Introducing Tiller Investments (Beta) and the Investments Builder Contest
Tracking investment holdings and position history is essential to understanding your complete financial life. That’s why we’re excited to announce Tiller Investments (Beta), which brings your holdings into Google Sheets alongside the rest of your transactions, balances, and net worth.
To mark the launch, we’re running the Investments Builder Contest.
Build a dashboard, chart, report, or visualization using Holdings or Holdings History data, share it in the Tiller Community, and enter for a chance to win up to $1,000!
See your investment holdings in Google Sheets
Investments (Beta) adds two new sheets to Tiller:
- Holdings brings your current investment positions into a consistent spreadsheet structure.
- Holdings History keeps a history of that holdings data, so you can examine changes over time.
These source sheets provide the underlying holdings data. You decide how to calculate, compare, and show it.
Compare holdings across accounts. Examine asset allocation. Follow changes over time. Or build a dashboard around an investment question that matters to you.
Because the data is in Google Sheets, you can use formulas, pivot tables, conditional formatting, charts, and other native spreadsheet features to build the view you want.
- Read the announcement in the Tiller Community
- Read more about Tiller Investments (Beta) via Help Docs
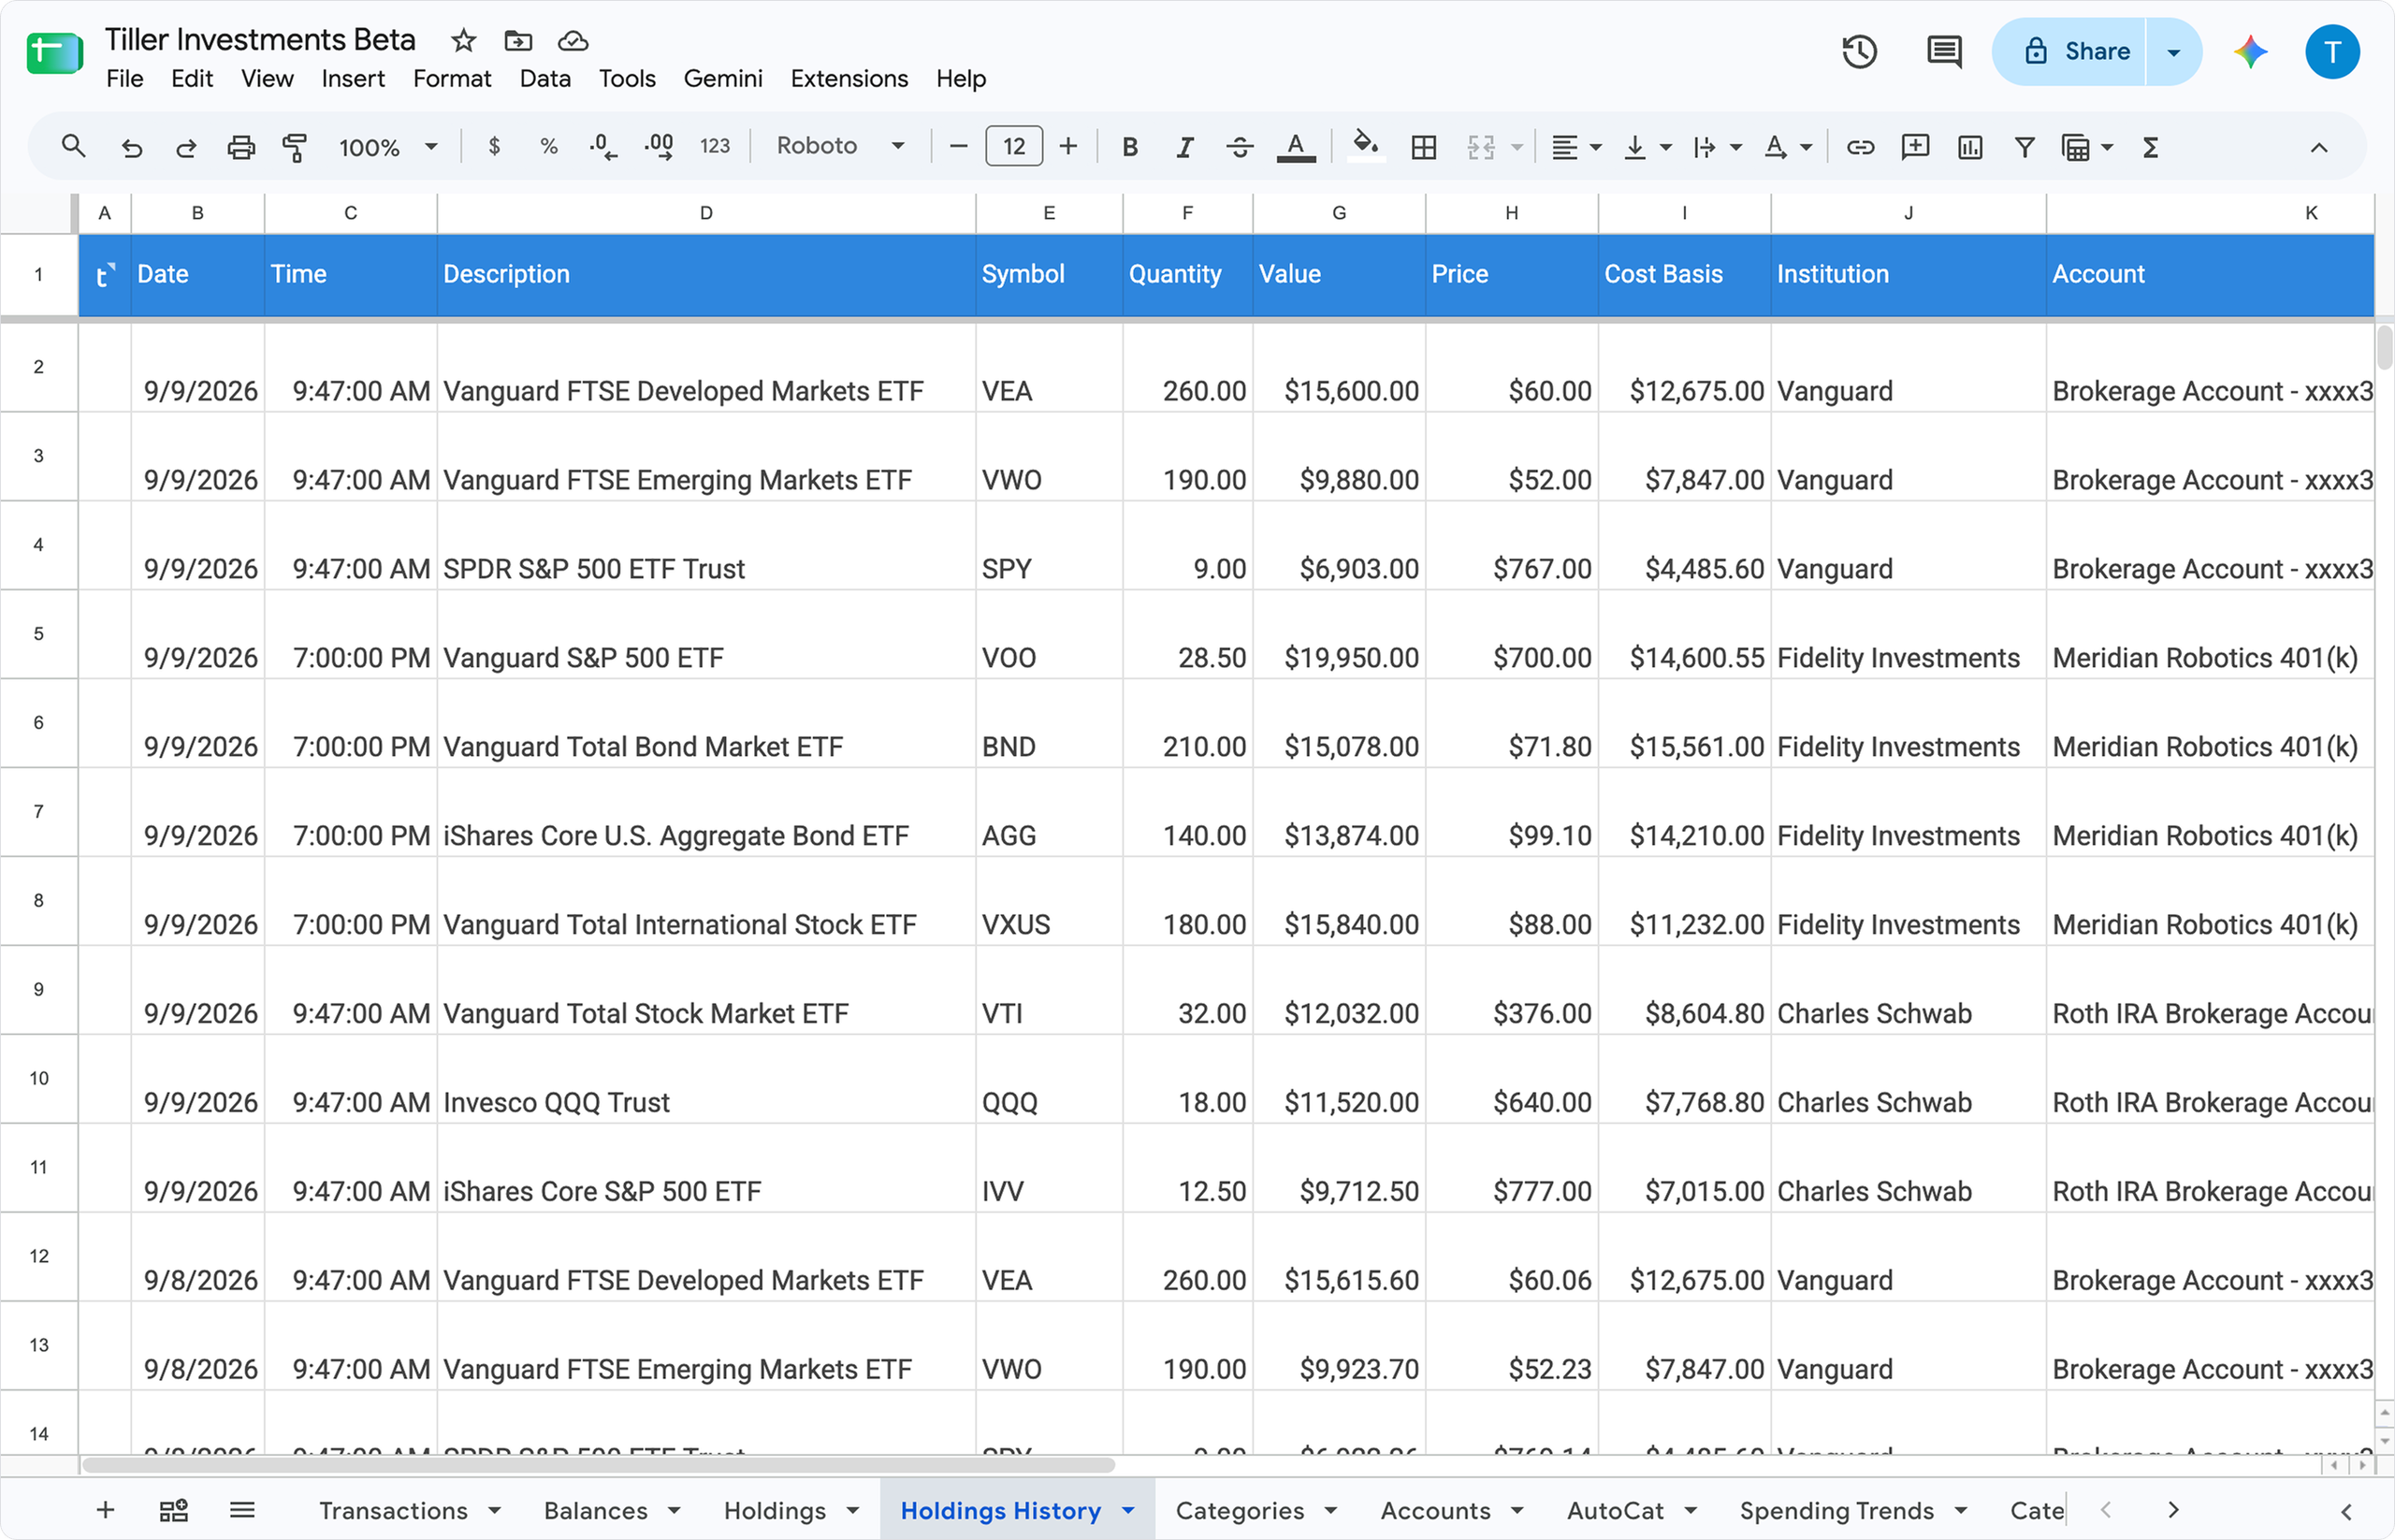
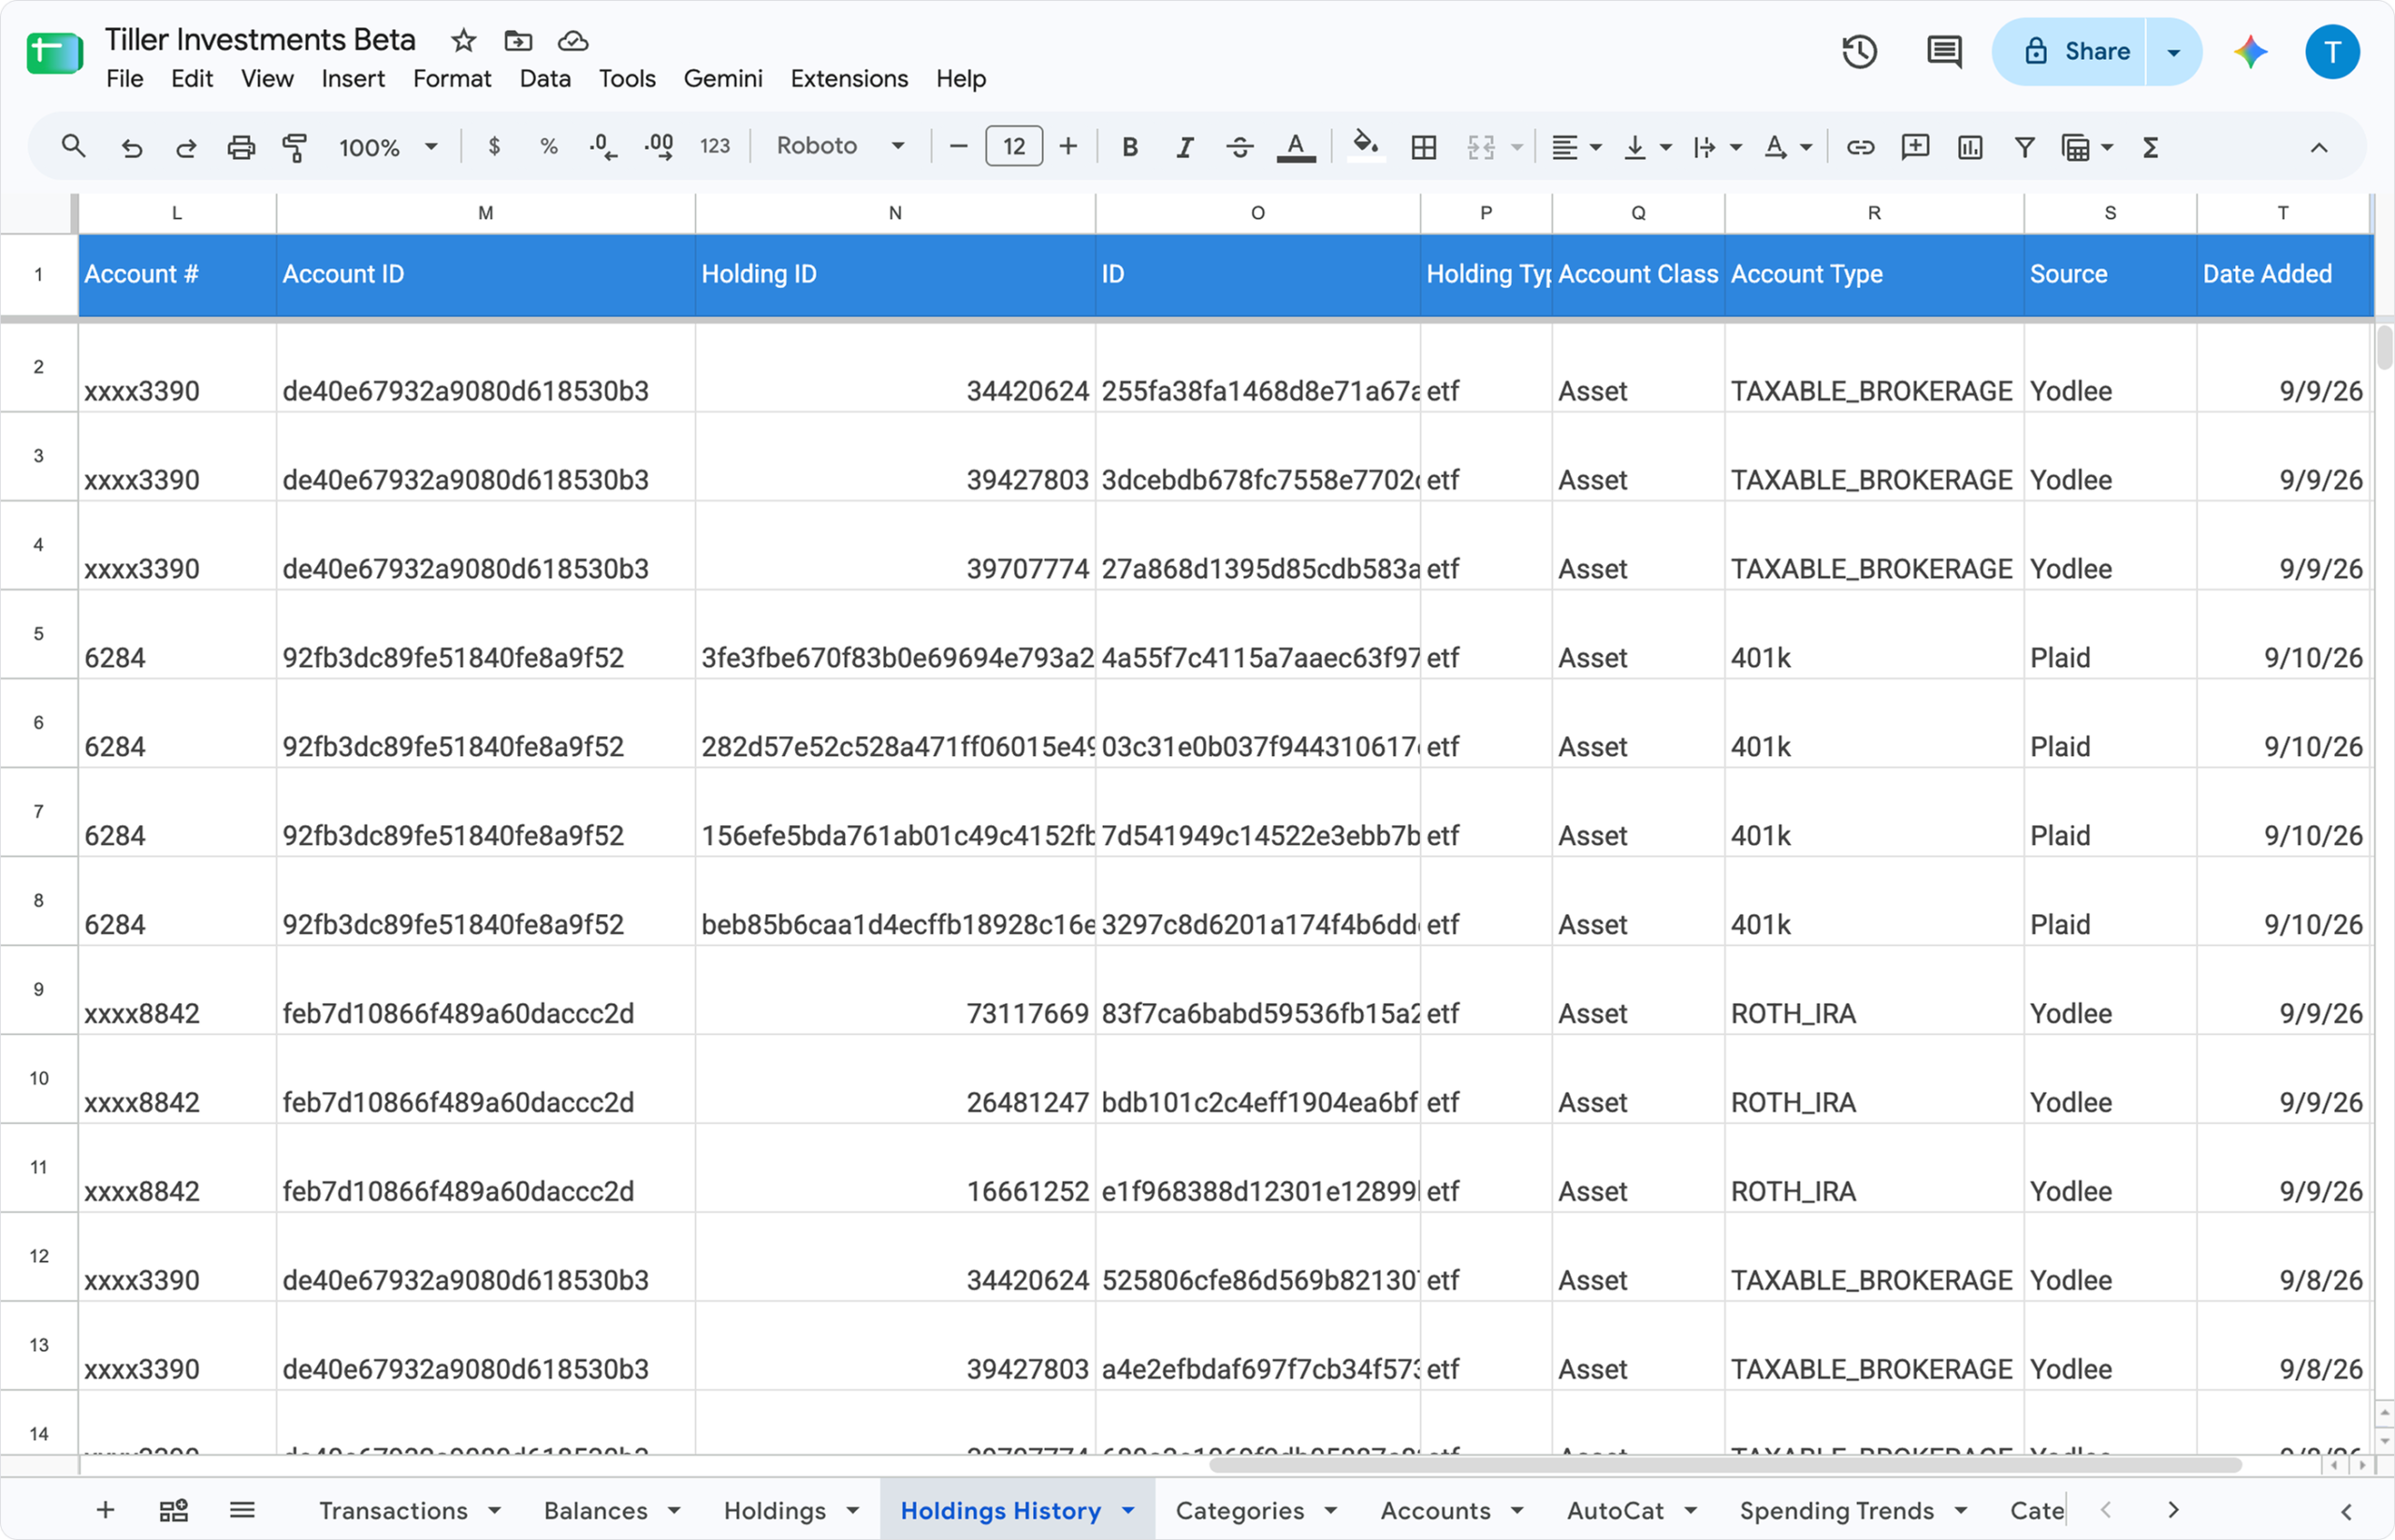
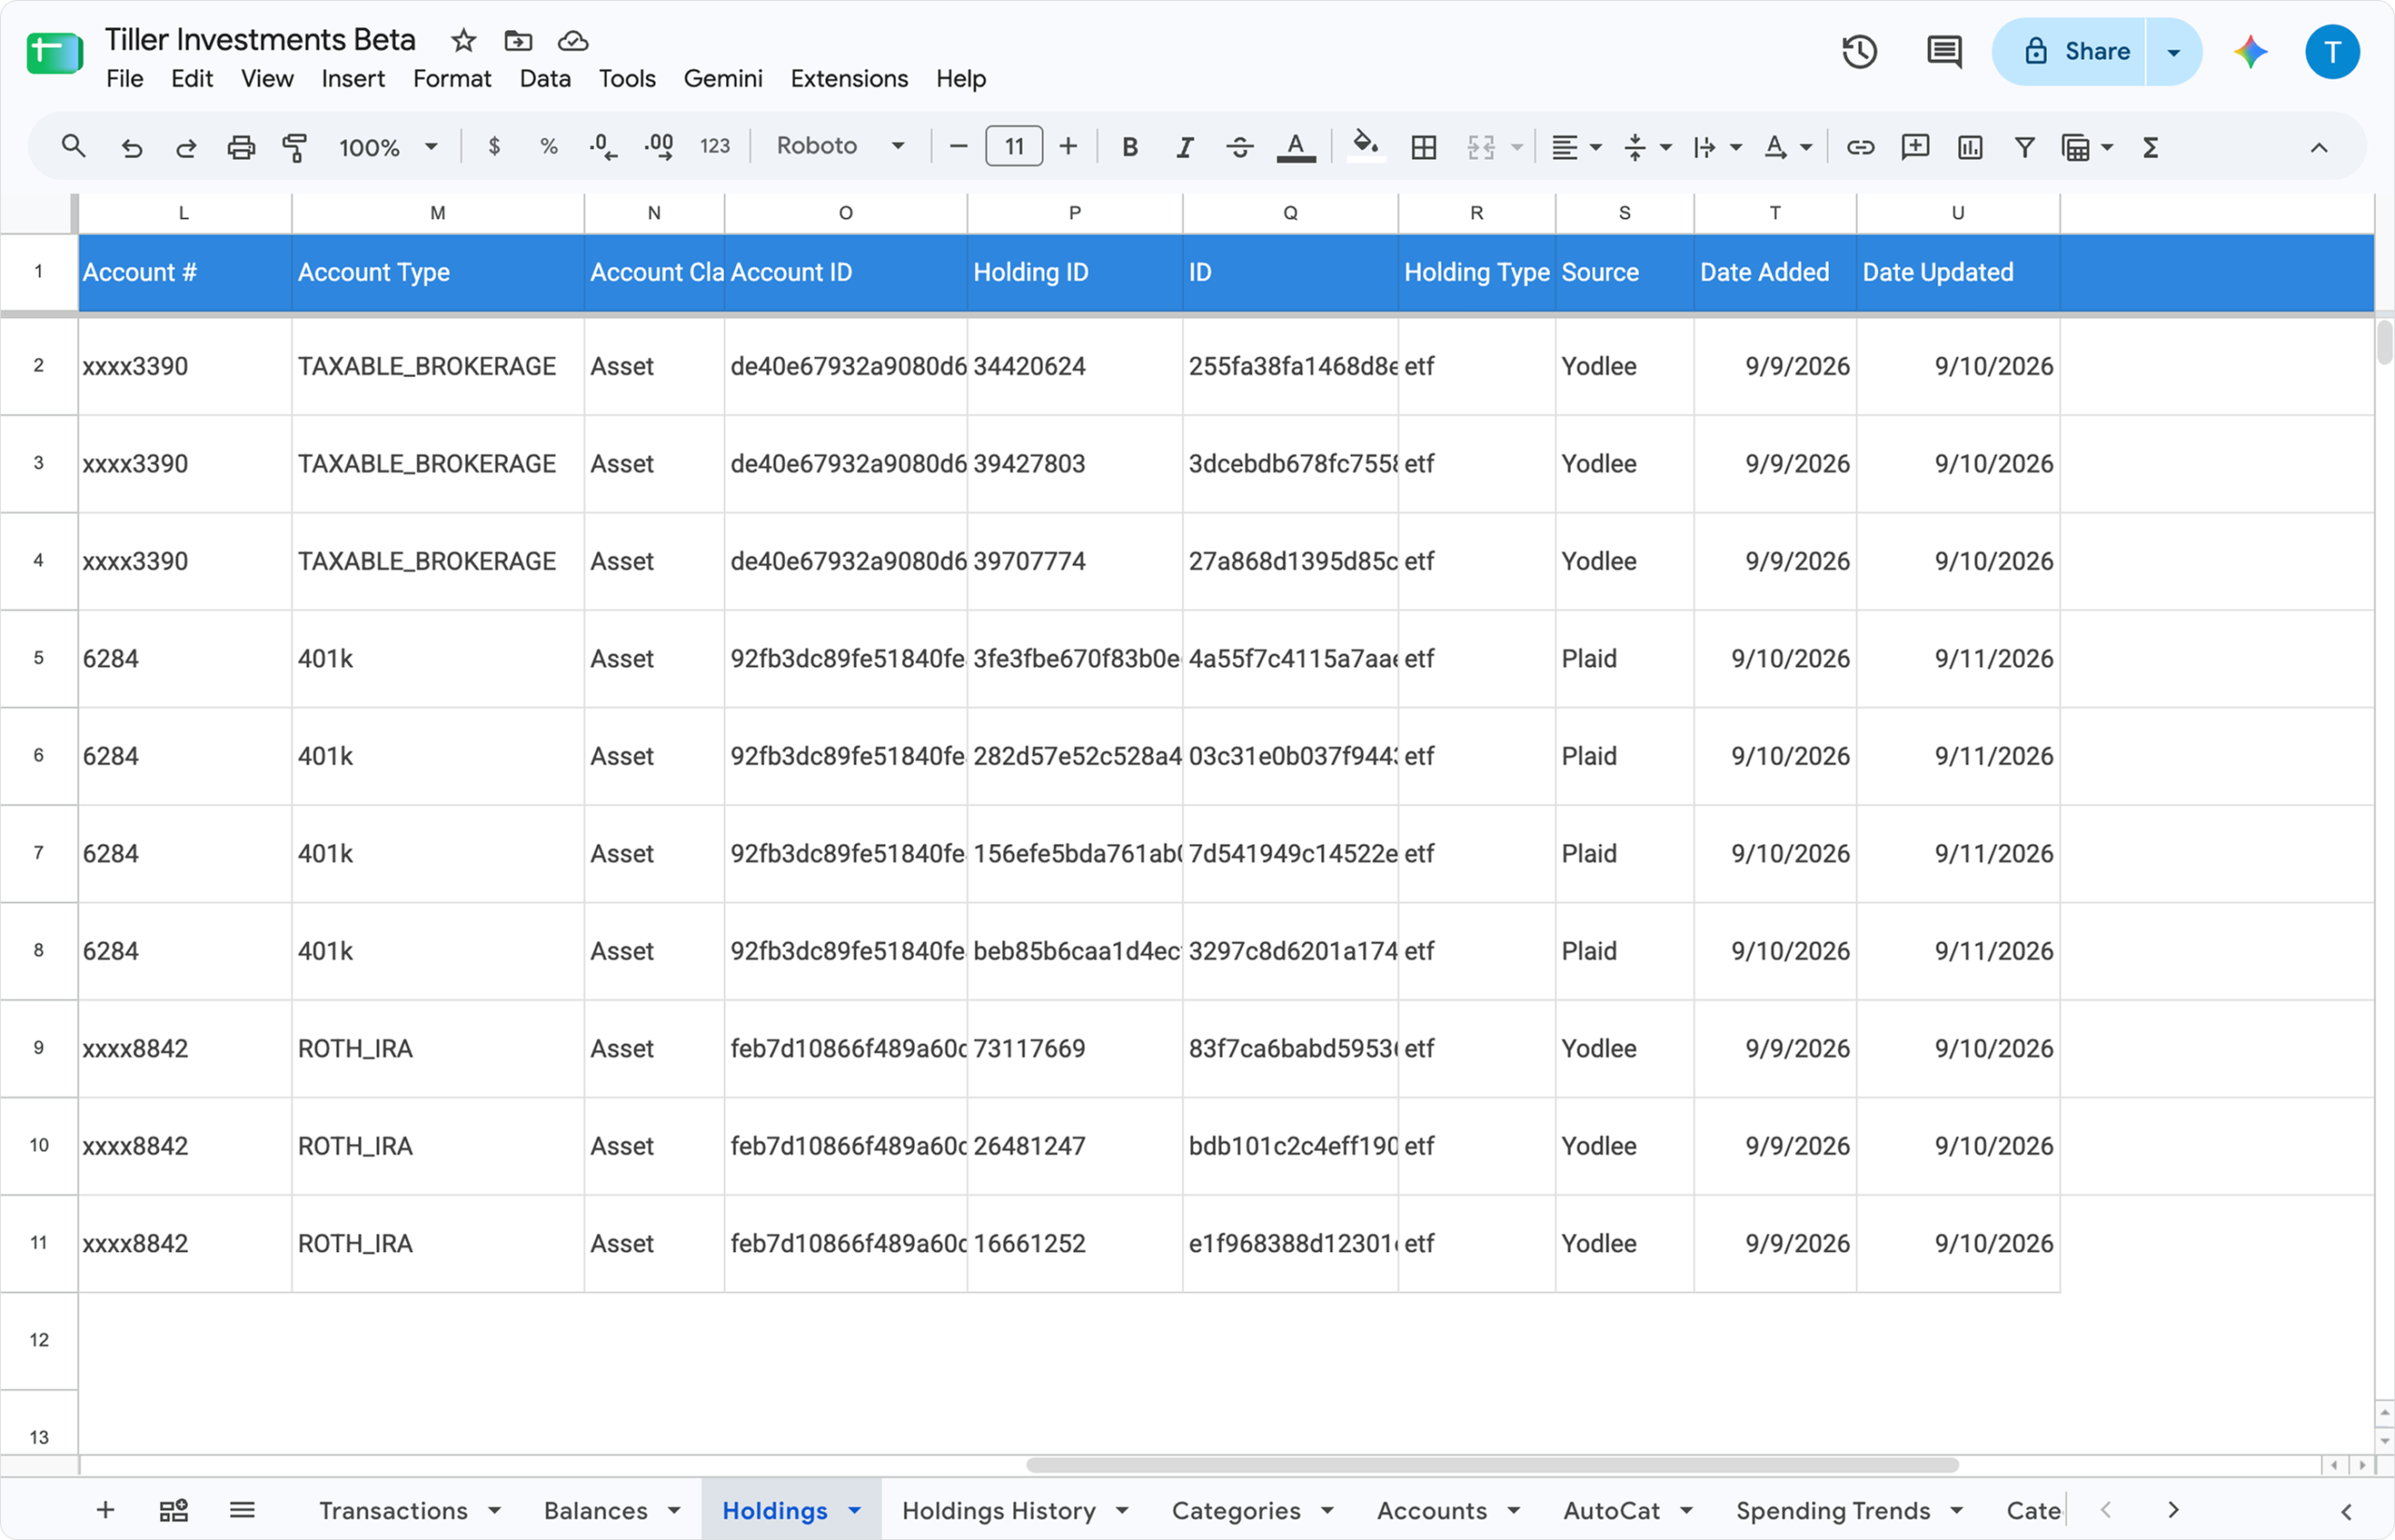
Get Investments (Beta)
- Open the Tiller Console and add your eligible investment accounts if they aren’t already connected. (Note: dummy data available here.)
- Add the Holdings and Holdings History sheets to a Tiller-powered Google spreadsheet from the Tiller Console.
- Watch the holdings data flow in.
- Start building.
You’ll have full access to all features while they’re in beta. We’ll share more information about access after the features move out of beta.
Holdings are available only for Direct Fills Google Sheets. We plan to offer holdings for Microsoft Excel soon.
About the Builder Contest
The Investments Builder Contest challenges you to build a clear, useful way to answer a specific question using the Holdings or Holdings History data.
Wondering what to build? Strong entries often begin with a specific question, and make the answer easier to see, understand, and check.
“How are my investments allocated across accounts?”
“Where are my holdings concentrated?”
“How has my portfolio changed over time?”
Your entry might help someone:
- See how investments are allocated across accounts
- Find concentration in a security, account, or asset class
- Compare current holdings with earlier holdings
- Monitor allocation changes
- Explore a specific question about a portfolio
- Understand investment holdings through a clear dashboard
Prizes
- First place: $1,000
- Second place: $500
- Third place: $250
- Community Choice: $100
- Early builder awards: The first five compelling solutions will each receive one year of Tiller free.
- Participants are eligible to receive multiple awards across all categories for a single submission.
Contest schedule
- September 16, 2026: Submissions open
- October 25, 2026: Submissions close
- October 26 through November 17, 2026: Tiller judging
- Sept 16: Community voting opens
- Nov 17: Community voting closes
- November 18, 2026: Community votes counted and winners announced
All deadlines are 11:59PM Eastern Time
How to enter
1. Build your entry
Build a dashboard, chart, report, tracker, or other eligible spreadsheet experience using the Holdings sheet, Holdings History sheet, or both.
We recommend building off the Holdings sheet unless your entry requires historical data and using the Foundation Template as your base.
You may build with:
- Your own holdings data from Investments (Beta)
- Manually entered data using the Holdings or Holdings History structure
- The Sample Holdings Data
Never publish the spreadsheet connected to your personal financial accounts. Create a clean, shareable copy using sample or anonymized data before submitting your entry.
2. Document and share it
Create a new topic in the Tiller Community’s gSheets Templates category.
Add the Investments-Builder-Contest tag and include:
- A plain-language explanation of the question your entry answers
- A link to a clean, shareable copy of the finished spreadsheet
- Step-by-step installation and setup instructions
- Instructions for using the dashboard or other build
- At least one screenshot or short recording of the finished entry
- Any required configuration, assumptions, limitations, or known issues
A one- to five-minute video walkthrough is strongly encouraged.
Before sharing, check the entire file for personal information. Review visible and hidden sheets, formulas, named ranges, notes, comments, screenshots, recordings, and file history.
3. Submit your entry
Complete this Google form and include the link to your Community post.
Entries are not complete until the submission form has been received.
Entry requirements
To qualify, an entry must:
- Use the Holdings sheet, Holdings History sheet, or both as its primary data source.
- Live inside a Tiller-powered Google spreadsheet and use the standard structure of the eligible source sheets.
- Not use Apps Script, third-party tools, and third-party add-ons.
- Update dynamically when the referenced Holdings or Holdings History data changes.
- Include a clean, shareable version judges can copy and test.
- Include the required explanation, setup instructions, usage instructions, and visual demonstration in its Community post.
- Follow all eligibility, submission, and licensing requirements in the official contest rules.
How entries will be judged
Qualifying entries will be evaluated based on:
- Usefulness: Does the concept offer value to the personal-finance community by answering an important investment-related question?
- Use of Investments (Beta): Does it demonstrate the value of the Holdings or Holdings History data?
- Originality: Does it offer a distinctive idea or approach?
- Usability: Is the experience clear, intuitive, and well designed?
- Technical feasibility and reliability: Is the solution technically feasible, does it update correctly, and does it perform consistently?
- Documentation: Can another person understand, install, and use what the builder made?
Community Choice
The qualifying entry with the most eligible Community votes will receive the $100 Community Choice award
(Beta) feedback and support
Investments Beta is still being tested and improved. If you find a problem or have feedback, reply to the Community announcement or email beta@tiller.com.
During the beta, Tiller will not escalate holdings-data support tickets to its data providers. Please complete this feedback form to report any issues with missing or inaccurate date or any other feedback related to this feature.
More information about access to Investments features after the beta will be announced before the beta ends.
Eligibility and official rules
- Must be built off the Holdings sheet and/or Holdings History sheet. Manual entries to Holdings History or Holdings are accepted.
- Must live inside a Tiller powered sheet. We recommend starting with the Foundation Template as your base.
- Native Google Sheets or Excel functions only — formulas (QUERY, FILTER, ARRAYFORMULA, SPARKLINE, HSTACK, etc.), conditional formatting, built-in charts or pivot tables.
- Cannot require Scripts or 3rd party tools/add-ons. Entries cannot require Apps Script in order to run.
- Must update dynamically. Formulas/charts reference live Holdings sheet or Holdings History sheet ranges so the dashboard updates as new data fills, rather than a one-time static report.
- You, the builder, are based in the U.S. and over the age of 18
- Though you, the builder, will maintain ownership, copyright, and any other kinds of rights to the content, you grant Tiller an unlimited, non-exclusive license to use the resulting content, and/or portions of the content or derivatives of the content, in any way and for any purpose as Tiller solely determines.
- Community post must include:
- A plain-language explanation of what question it answers (e.g., “how diversified am I across accounts,” “how’s my portfolio trending vs. a benchmark,” “what’s my asset allocation drift”).
- Step-by-step setup instructions on how to set up
- A screenshot or short recording of the finished dashboard. 1 to 5 minute video overview strongly encouraged.
By submitting an entry, you agree to the official Investments Builder Contest rules.
Read the Tiller Community announcement here.
Get to know the new holdings sheets