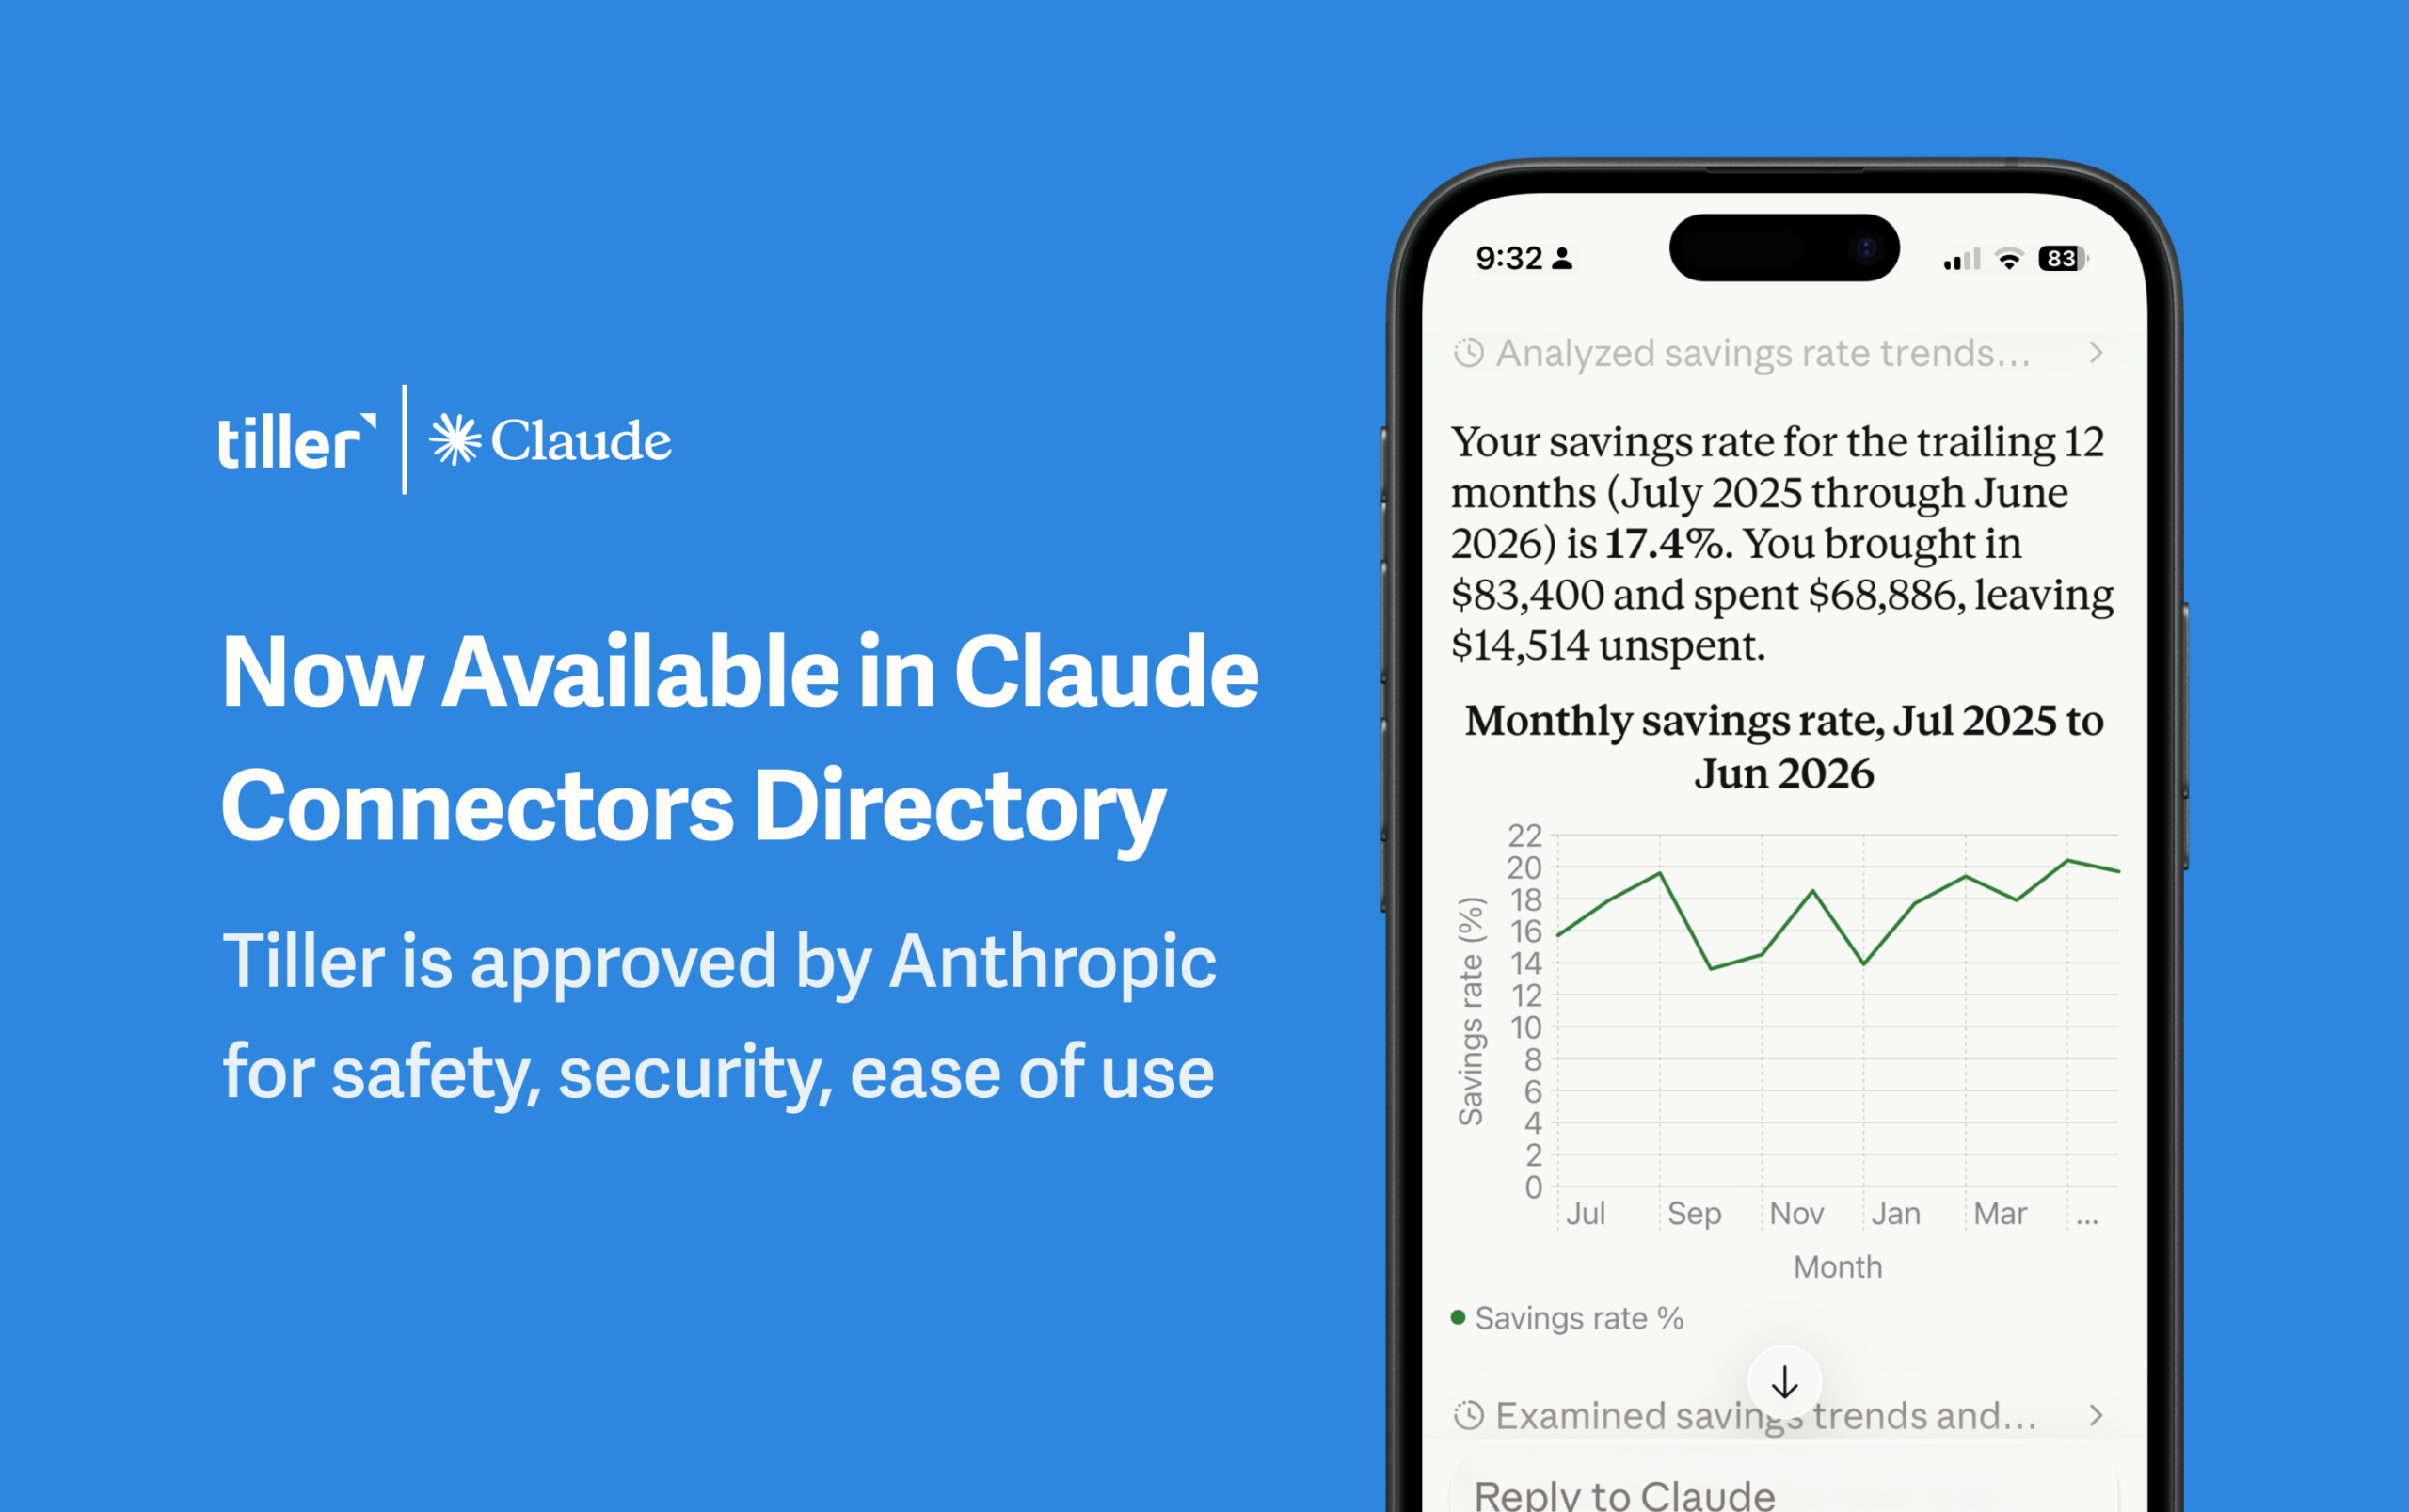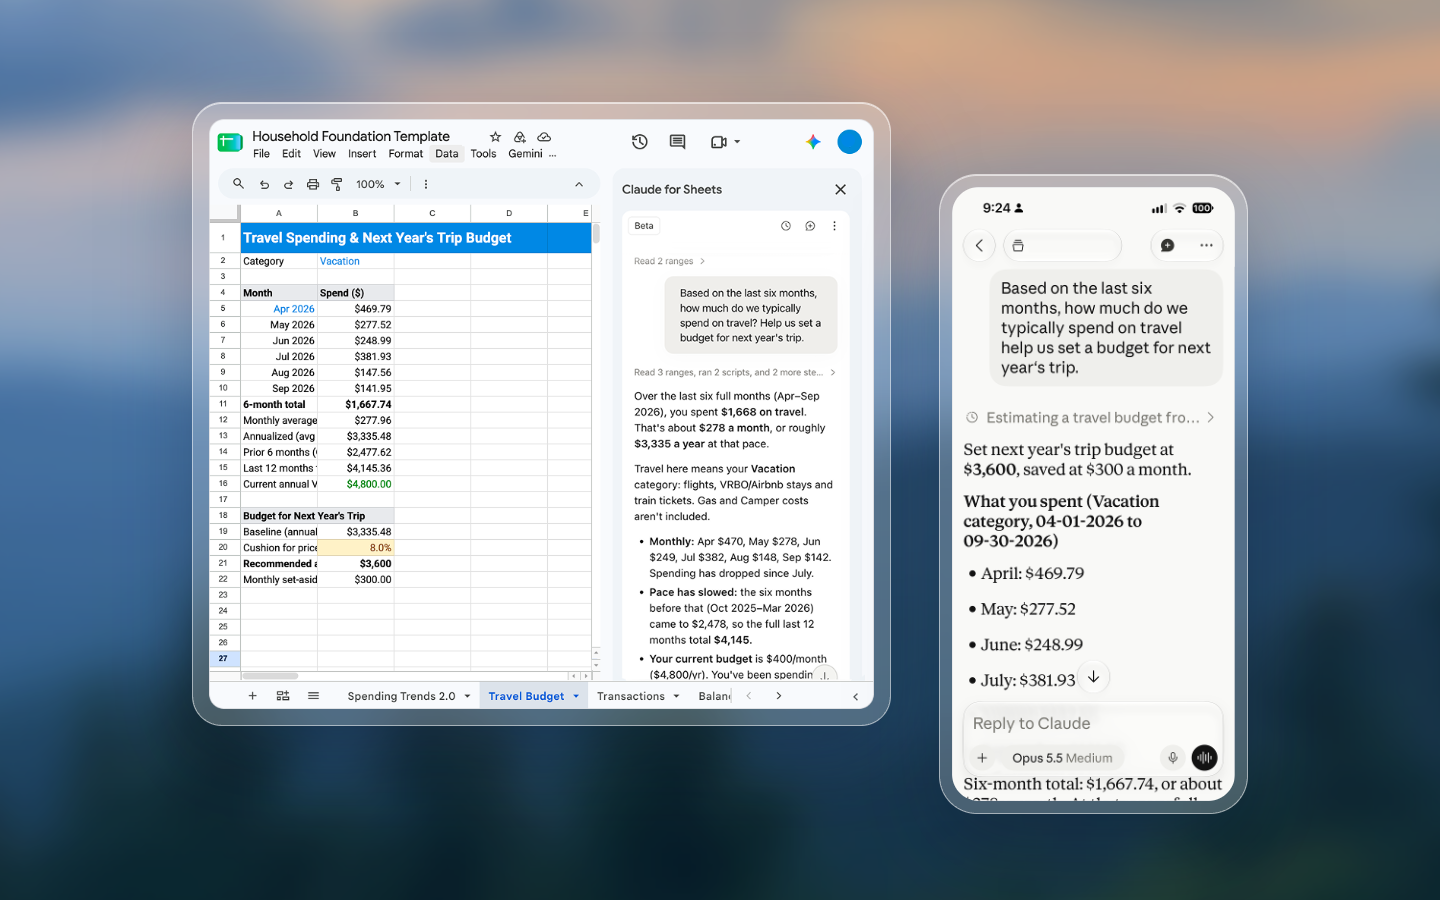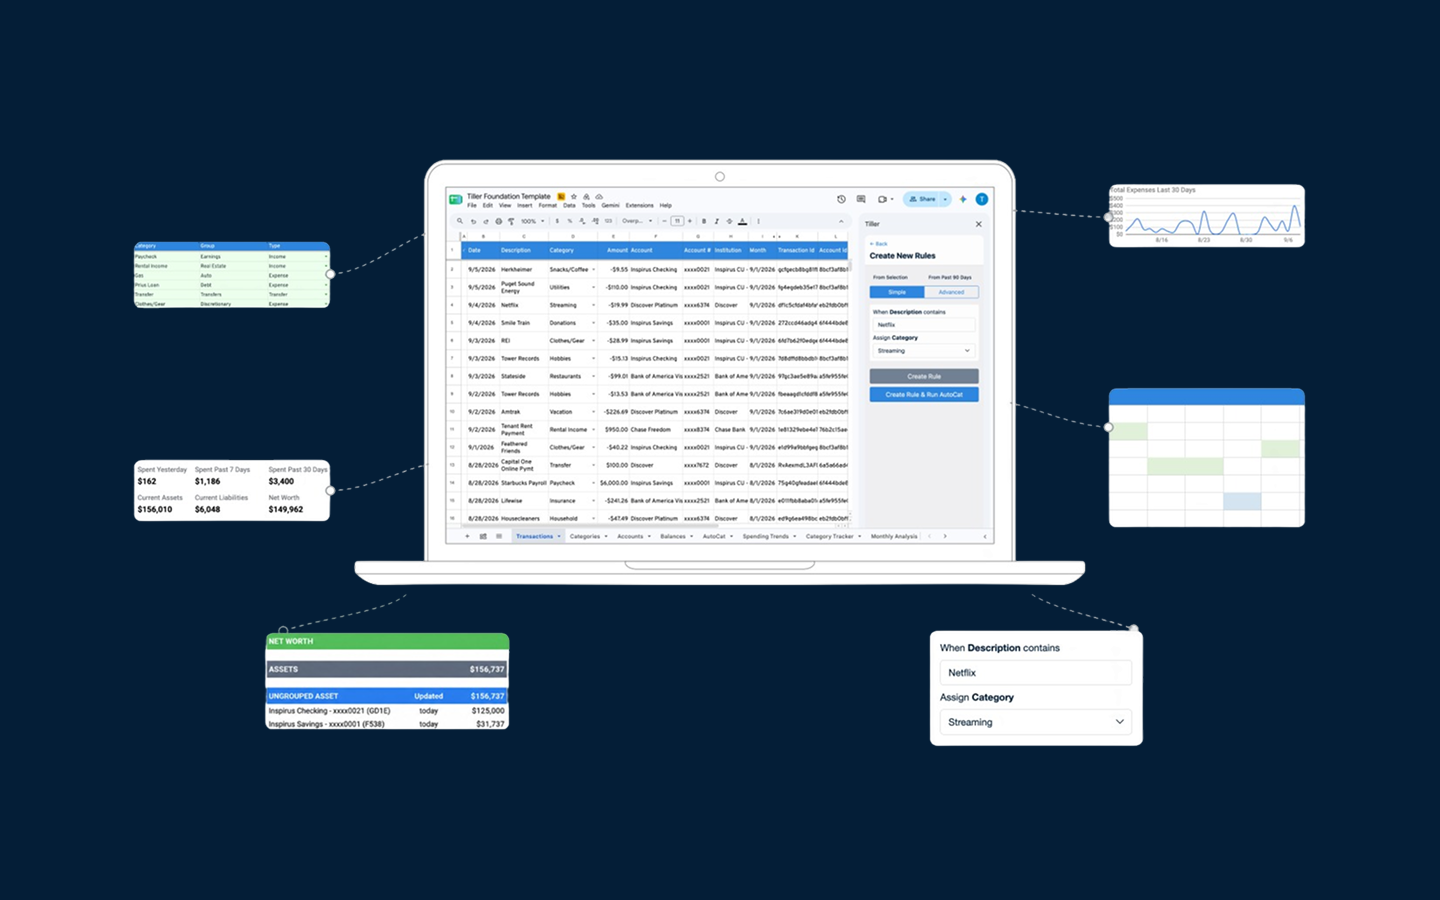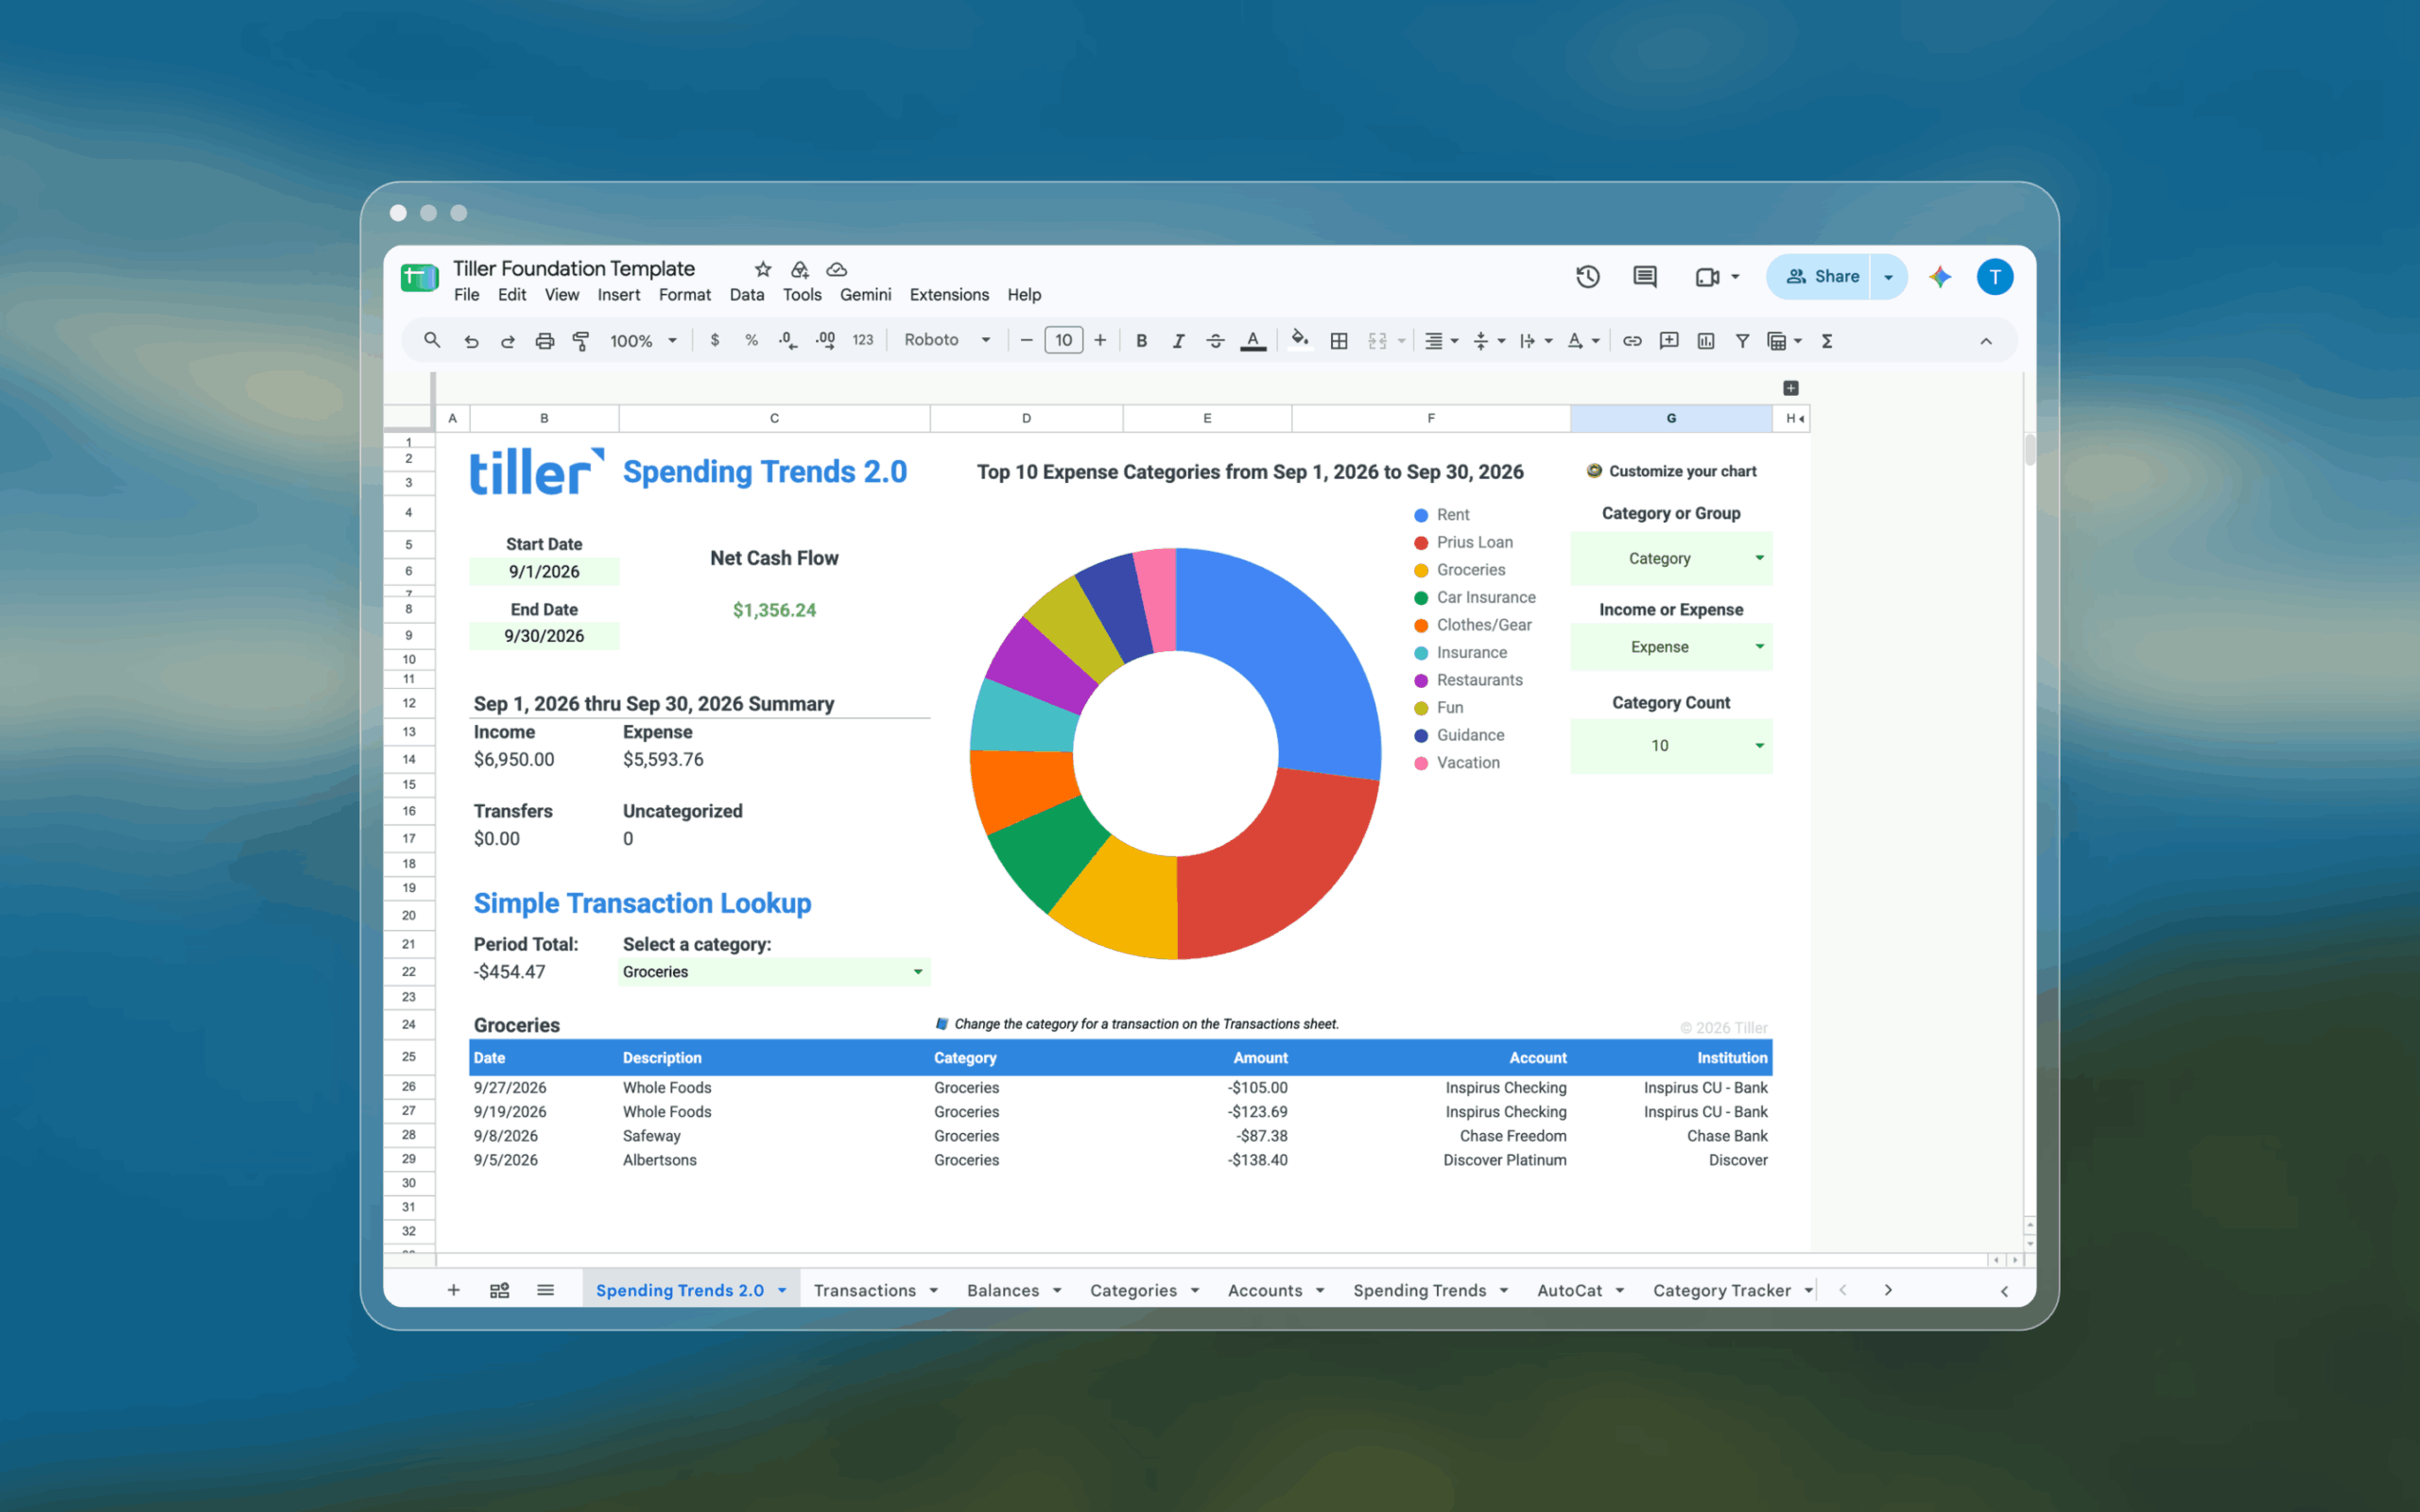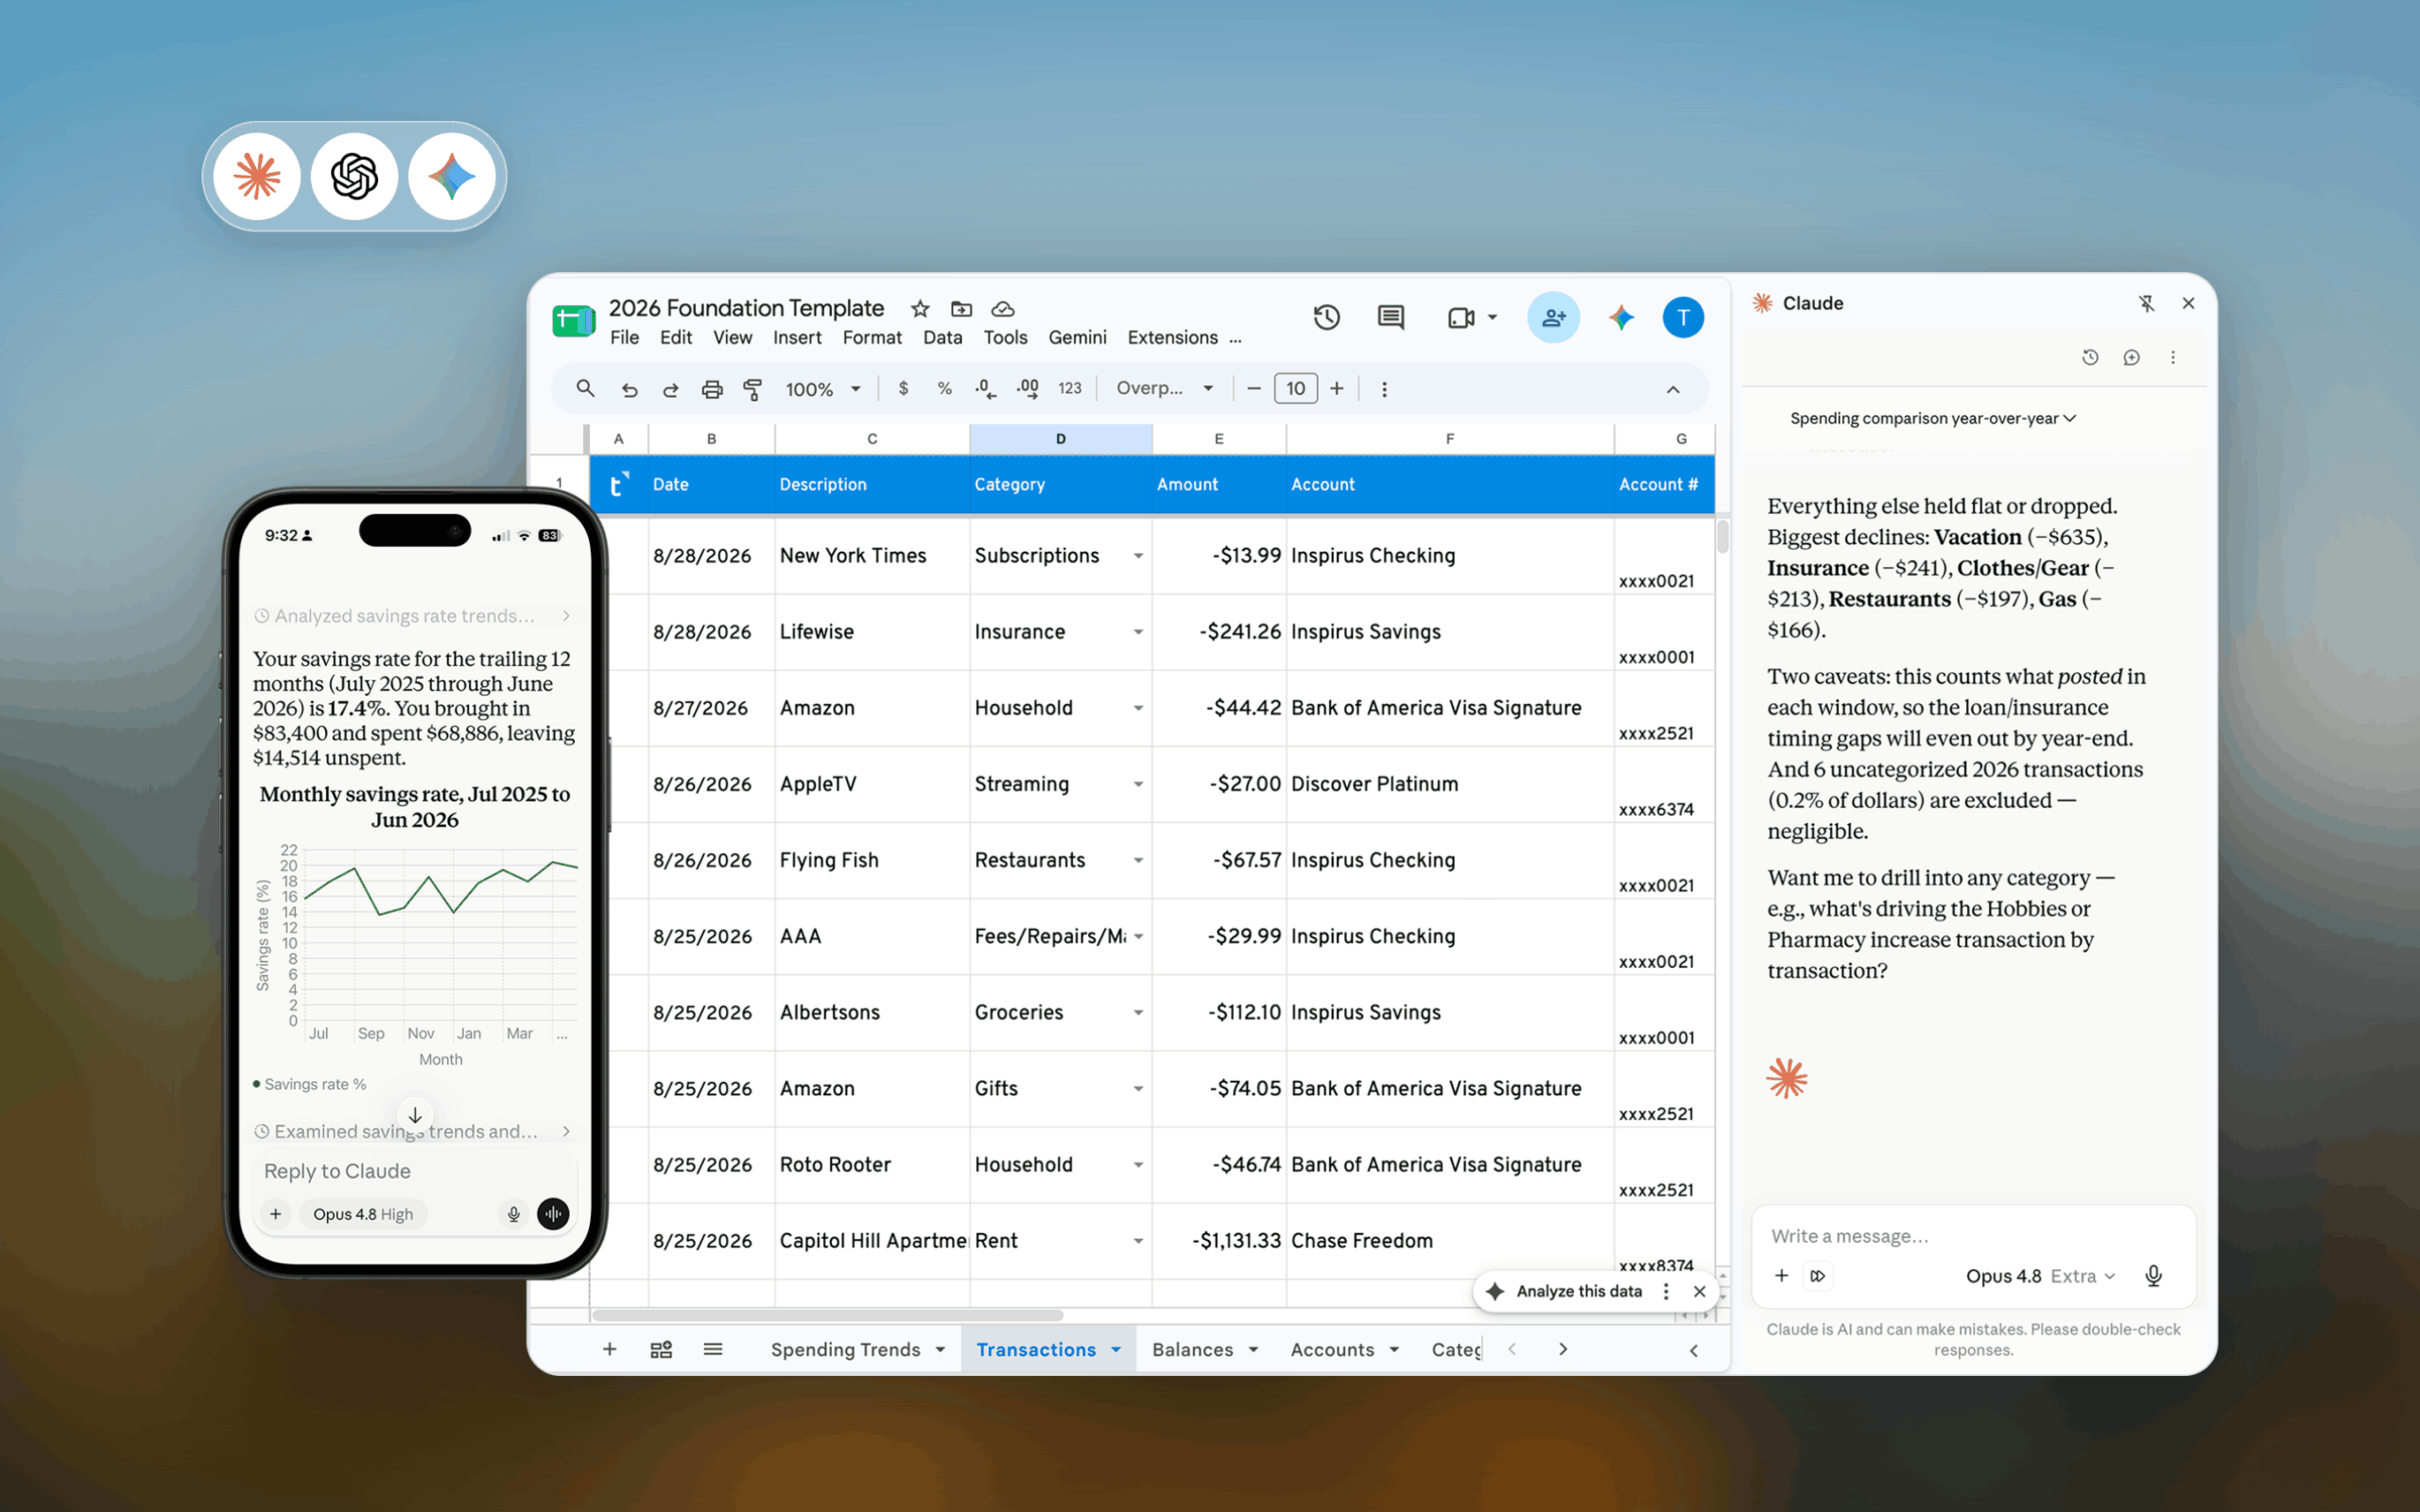

AI can now build and edit financial spreadsheets in minutes, but you still need to know the numbers are accurate. Pairing the new Claude add-on for Google Sheets with Tiller gives you both: Claude does the build, and your spreadsheet lets you check every formula against your real transaction data.
Quick answer: The Claude add-on for Google Sheets runs in a sidebar inside your sheet and can edit it directly. In our demo, one prompt turned Tiller’s Simple P&L template into a budget vs. actual report in about 10 to 15 minutes. Because Tiller keeps your data in an open spreadsheet, you can verify the result yourself with formulas, filters, and pivot tables. No black box.
What is the Claude add-on for Google Sheets?
The Claude add-on is a Google Workspace extension that opens Claude in a sidebar right inside Google Sheets. Unlike chatting with Claude in a separate app, the add-on can read your sheet’s structure and make edits directly: adding columns, writing formulas, and applying formatting. It launched in early October 2026.
To install it:
- Open the Claude add-on in the Google Workspace Marketplace.
- Click Install and grant access to your Google account.
- Open any spreadsheet and go to Extensions, then Claude, to open the sidebar.
You need a paid Claude plan to use the add-on.
The request: year-to-date budget vs. actual
This demo started with a request in the Tiller Community. A user wanted the Yearly Budget template to show year-to-date budget vs. actual figures, which it doesn’t do today.
Rather than rebuild the Yearly Budget, we started from the Simple P&L template. It already supports flexible time periods, including custom ranges, and can display up to 24 months of data. What it lacked was any view of budgets. That made it a good base for Claude to extend.
What Claude built in the Simple P&L
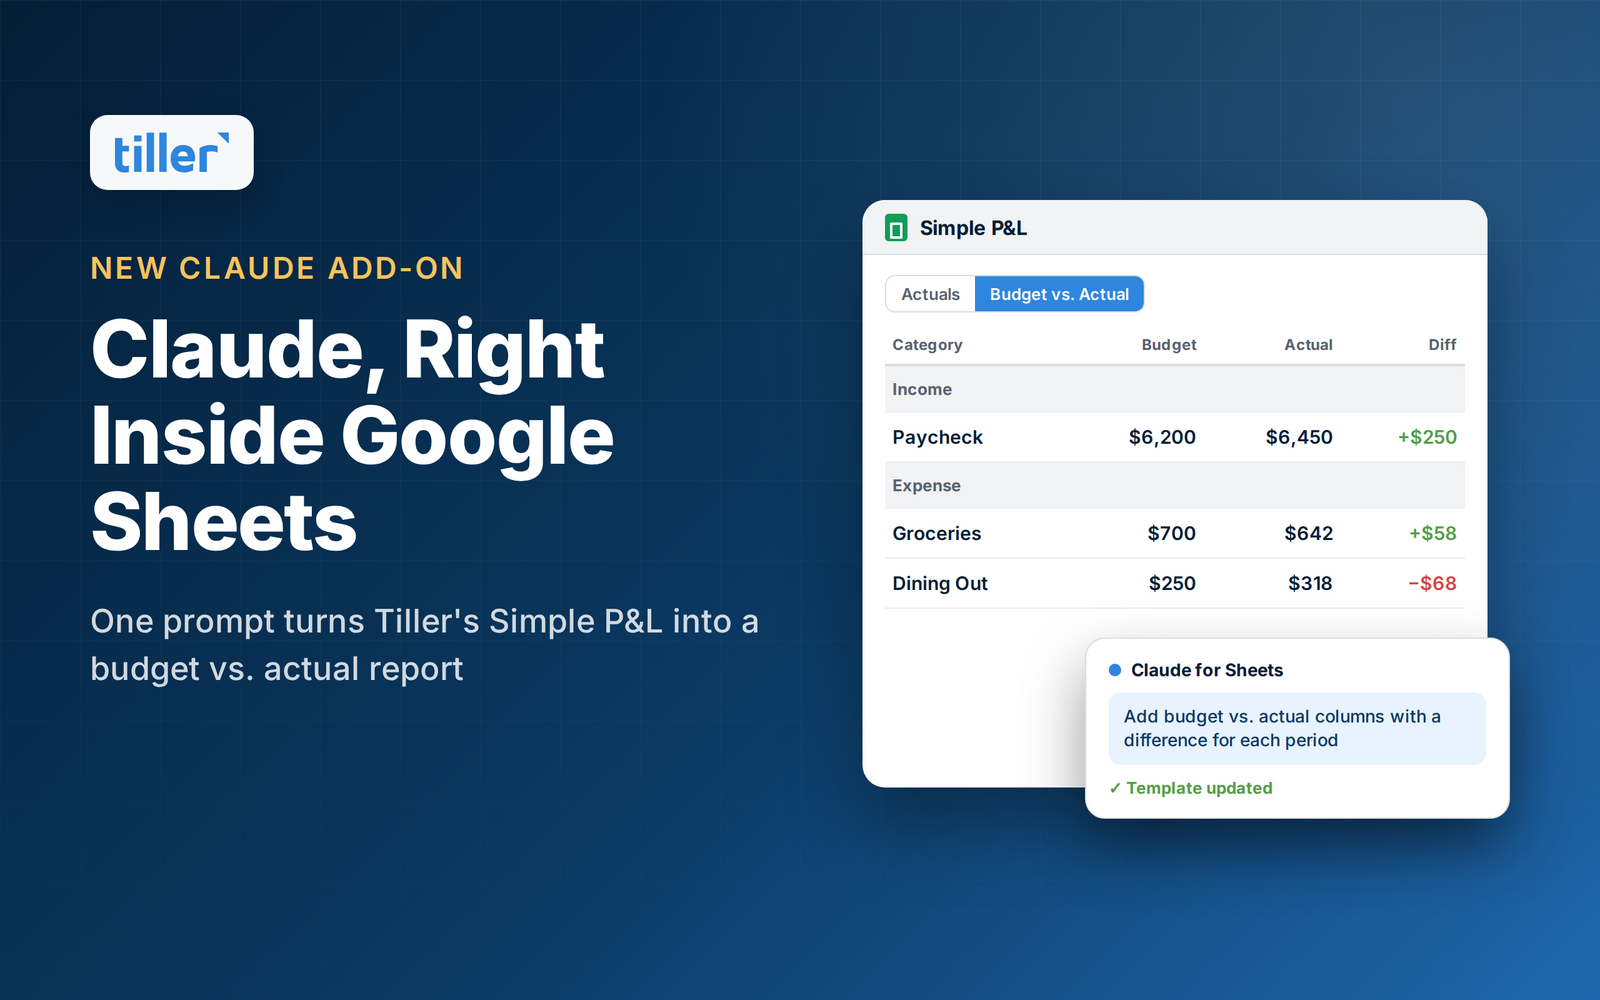
With one prompt pasted into the sidebar, Claude added a budget vs. actual mode to the template. The finished version includes:
- A view picker that switches between Actuals (the template as it works today) and Budget vs. Actual.
- Totals columns showing total budget, total actual, and the difference for the selected period.
- Per-period columns for budget, actual, and difference in every month shown, when the budget view is on.
- Matching formatting, reusing the template’s existing styles for income, expense, and group rows.
The build took about 10 to 15 minutes of Claude working on its own.
Why the prompt mattered
The final prompt came out of about an hour of earlier back-and-forth with Claude. That iteration produced a detailed map of the template, which is what made the one-shot build reliable. The prompt described:
- The template’s layout, including the hidden helper area to the right of the visible report.
- How to treat income vs. expense categories so differences calculate in the right direction.
- The existing formatting conventions and conditional formatting rules.
- Where key columns live on the Transactions sheet.
- The exact columns to add for each view.
If you want to try something similar, expect to spend time on the prompt first. The clearer the template map, the less Claude has to guess.
Why a spreadsheet is the right place for AI-built finance tools
The biggest risk with AI-generated financial reports isn’t that they look wrong. It’s that they look right and aren’t. A clean report with a subtle sign error or a missed category can steer a budget decision for months.
That’s where Tiller’s spreadsheet-native approach matters. When Claude builds inside a Tiller sheet, nothing is hidden:
- Every formula is visible. Click any cell Claude created and review exactly how it calculates the number.
- Your source data sits next to the output. Your Transactions and Categories sheets are right there, so you can trace any figure back to the transactions behind it.
- You can check it a second way. Build a quick pivot table or SUMIFS from the raw Transactions sheet and compare it to Claude’s totals. If two independent methods agree, you can trust the result.
- You can fix what’s off. If one column is wrong, you edit that formula, or ask Claude to, without starting over.
Compare that with a budgeting app where an AI feature produces a number on a screen. You can’t open it up, can’t see the logic, and can’t easily check it against your raw data. For your finances, being able to verify the math is not optional.
Building Tiller templates used to mean hours of careful formula work and edge-case testing by a person. AI now handles most of the build. Validation is still on you, and a spreadsheet is the tool that makes validation practical.
Tips on how to validate what Claude built in your Tiller sheet
Before relying on an AI-modified template, here are some tips on checking Claude’s work. Most take a few minutes each.
- Make a copy first. Run the build on a copy of your sheet or the Tiller demo sheet so your working budget stays untouched.
- Pick one month and one category. Choose something you know well, like Groceries last month, and confirm the actual amount by filtering the Transactions sheet.
- Cross-check totals with a pivot table. Create a pivot table from Transactions with Category as rows, Month as columns, and Amount as values. Compare it to the report’s actuals.
- Check budgets against the Categories sheet. Confirm the budget figures match what you entered for those months.
- Test the sign on differences. Income over budget and spending under budget should both read as favorable. Check one of each.
- Watch the edge cases. Look at transfers, uncategorized transactions, hidden categories, and months with no budget set.
- Switch views and periods. Toggle the view picker and change the time period to confirm the columns update correctly.
- Read a few formulas. Click into the new columns and make sure the ranges cover all your data, not a fixed row count.
If something is off, describe the issue to Claude in the sidebar with the specific cell and the number you expected.
Claude add-on vs. the Tiller connector for Claude
There are now two ways to use Claude with your Tiller data, and they suit different jobs.
| Claude add-on for Google Sheets | Tiller connector in the Claude app | |
|---|---|---|
| Where you use it | Sidebar inside your Google Sheet | Claude chat (web, desktop, mobile) |
| Best for | Building or modifying templates, formulas, and layouts | Asking questions about your finances and making targeted data edits |
| What it can change | Anything in the open sheet | Any column on the Transactions sheet; adding categories and changing a category’s group or type |
Use the add-on when you want to change how your spreadsheet works. Use the connector when you want to work with your data from a chat, even when you’re away from your sheet.
FAQ
Can Claude edit Google Sheets directly?
Yes, with the Claude add-on for Google Sheets. It runs in a sidebar and can add columns, write formulas, and apply formatting in the open spreadsheet. The standard Claude chat with the Google Drive connector can read files but can’t edit a sheet the same way.
Does the Claude add-on for Google Sheets cost anything?
The add-on is free to install from the Google Workspace Marketplace, but it requires a paid Claude plan.
Can AI build a budget vs. actual report in Google Sheets?
Yes. In our demo, Claude added budget, actual, and difference columns to Tiller’s Simple P&L template in about 10 to 15 minutes from a single detailed prompt.
How do I know if an AI-built spreadsheet is accurate?
Check its totals against your raw data with a second method, such as a pivot table or filter on your Transactions sheet. Spot-check a few categories and months you know well, and read the formulas in the new columns.
Is it safe to use AI with my financial spreadsheet?
Work on a copy first, review every change before relying on it, and verify the numbers against your source data. A spreadsheet makes that review possible because every formula and transaction is visible.
Does this work with Tiller in Excel?
This demo uses Google Sheets. Claude for Excel offers a similar in-workbook experience for Tiller Excel users.
Watch the demo and try it yourself
Tiller automatically imports your bank and card transactions into Google Sheets or Excel every day. You get the flexibility of a spreadsheet you fully control, now with AI that can build in it and data you can always verify. Start a free trial of Tiller.
- Get the Claude add-on for Google Sheets
- Read the original Community request
- Questions? Ask in the Tiller Community or email support@tiller.com.